Bullish view
- Buy the BTC/USD pair and set a take-profit at 53,000.
- Add a stop-loss at 50,000.
- Timeline: 1-2 days.
Bearish view
- Set a sell-stop at 51,000 and a take-profit at 50,000.
- Add a stop-loss at 52,000.
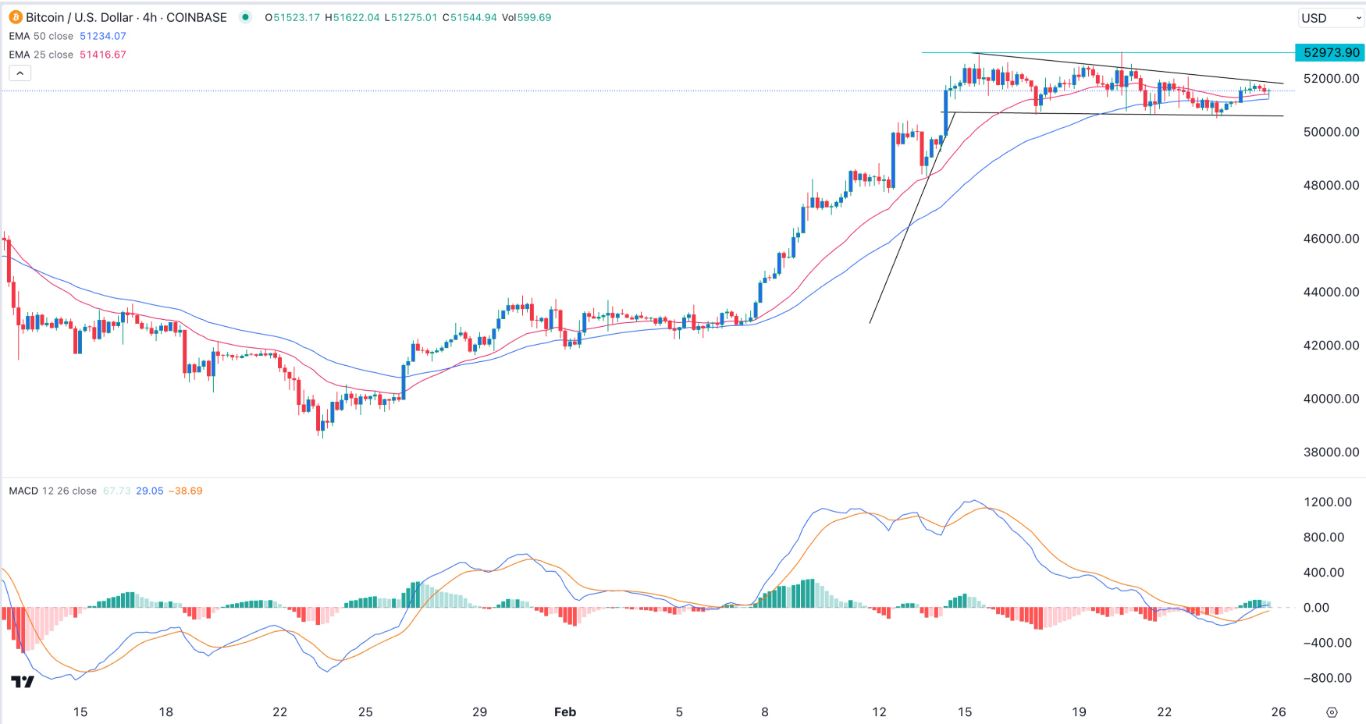
The BTC/USD pair moved sideways on Monday as traders waited for the next important news in the industry. Bitcoin was trading at $52,000, a few points below the year-to-date high of $53,000. This pause is common after BTC makes a strong move as it has done in the past few weeks when it rose from $38,500 to $53,000.
Bitcoin consolidation continues
The BTC/USD continued to consolidate even as an upbeat happened in the financial market, with the fear and greed index jumping to the extreme greed zone. Some of the top global stock indices have jumped to their all-time highs.
They include indices like Japan’s Nikkei 225 and Topix, Europe’s Stoxx 50, and US’s Nasdaq 100 and S&P 500. Most of the gains in US equities last week happened after the strong Nvidia earnings, which showed that there was strong demand for artificial intelligence.
Bitcoin’s performance is a sign that it is losing its correlation with American equities. In the past, the two assets tend to move in the same direction.
Top Forex Brokers
The BTC/USD pair has also wavered as traders watch the slowing inflows in Bitcoin ETFs. The iShares Bitcoin Trust (IBIT) ETF has over $6.4 billion in assets while Fidelity’s FBTC has about $2.3 billion in assets.
While these are encouraging numbers, there are signs that inflows are slowing as investors move back to stocks.
Bitcoin has also wavered as traders reflect on the actions by the Federal Reserve. Minutes released last week showed that most officials expect the bank will hold interest rates steady for a while amid rising inflation concerns. The Fed has been one reason why Bitcoin has staged a strong recovery in the past few months.
BTC/USD technical analysis
The 4H chart shows that the BTC/USD pair has been in a tight range in the past few weeks. It has formed a descending channel, which is shown in black. The pair is also consolidating at the 50-period and 25-period moving averages. Also, it has formed a bullish flag pattern, which is a popular sign of continuation. The MACD remains slightly above the neutral level.
Therefore, the pair will likely have a bullish breakout in the coming days. If this happens, the next point to watch will be at 53,000, its highest point this month. Before that, the pair may retest the lower side of the descending channel.
Ready to trade our daily Forex signals? Here’s a list of some of the best crypto brokers to check out.


