Bullish view
- Buy the BTC/USD pair and set a take-profit at 58,000.
- Add a stop-loss at 55,000.
- Timeline: 1-2 days.
Bearish view
- Set a sell-stop at 55,000 and a take-profit at 54,000.
- Add a stop-loss at 58,000.

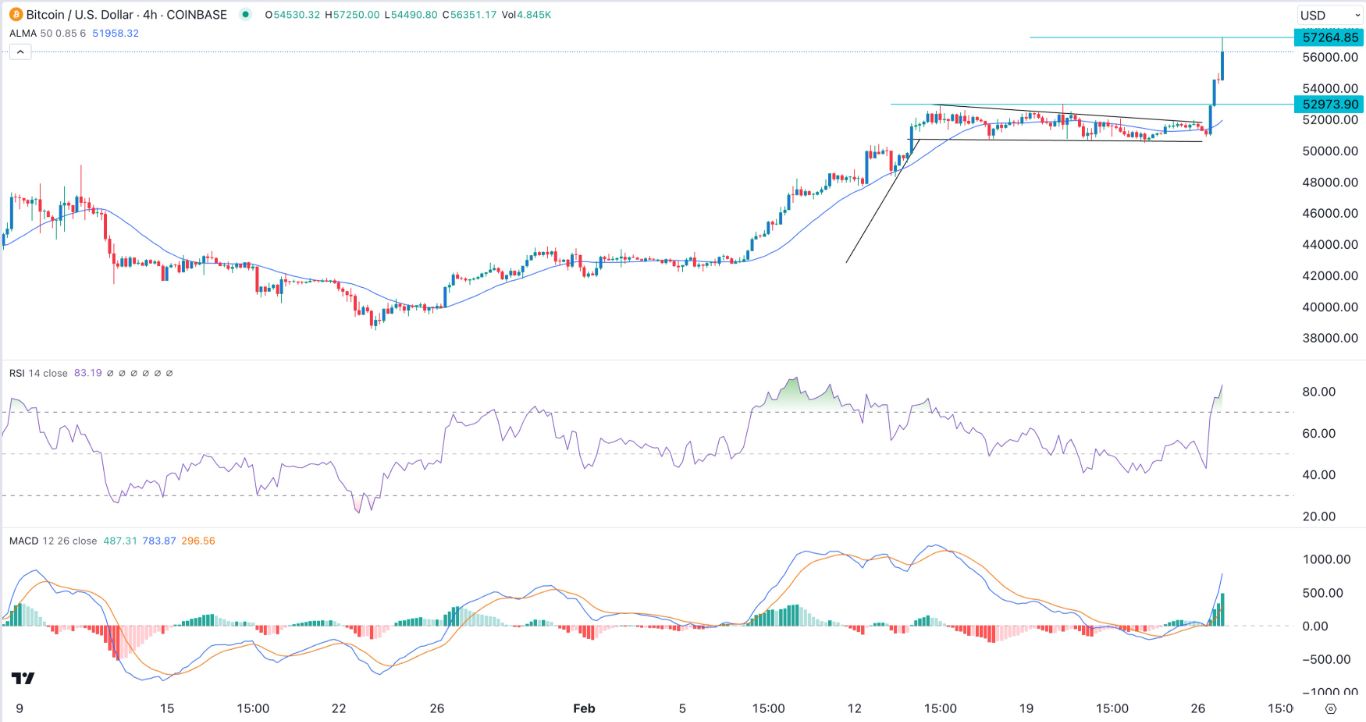
Bitcoin price made a strong bullish breakout as the crypto rally regained steam. The BTC/USD pair crossed the important resistance point at $56,000 for the first time in over two years. This means that the coin has soared by over 45% from its lowest point in 2024, making it one of the best performers in the market.
Bitcoin rally regains steam
The BTC coin bounced back in a high-volume environment as the recent consolidation ended and as the fear and greed index rose. Data compiled by CoinGecko shows that the volume in the past 24 hours stood at over $30 billion, its highest point in more than a week.
Bitcoin is rising because of the ongoing ETF inflows, which are leading to more demand at a time when supply in exchanges has retreated. The most recent data shows that the iShares Bitcoin ETF now has over $6.4 billion while the FBTC has moved to $2.5 billion.
Part of this inflow growth is that investors are moving from the Grayscale Bitcoin Trust (GBTC), which has lost assets in all weeks this year. Investors are moving from the fund because of its 1.50% expense ratio.
Top Forex Brokers
These inflows are also happening as some institutional investors move to Bitcoin, which has become a good alternative asset. Some investors are also moving from gold ETFs to Bitcoin.
The BTC/USD pair also retreated as the US dollar index (DXY) declined. The index retreated to $103.80, which was a few points below this month’s high of $105. It has retreated even as hopes of the Federal Reserve rate cuts faded.
Meanwhile, the coin is rising as traders focus on the upcoming Bitcoin halving event, which is set to happen in April. Historically, Bitcoin tends to do well ahead, and shortly after halving event.
BTC/USD technical analysis
Bitcoin has made a strong bullish trend this week as demand bounced back. The surge happened after the coin formed a bullish flag pattern, which is one of the most popular continuation signs. This pattern is characterized by a long vertical line that is followed by a consolidation phase.
It has remained above the 50-Arnaud Legoux Moving Average (ALMA). The pair also rose above the key resistance point at $52,973, its highest point this year. Further, oscillators point to renewed momentum.
Therefore, the outlook for the BTC/USD pair is bullish, with the next level to watch being at $58,000. The stop-loss of this trade is at 55,000.
Ready to trade our daily Forex signals? Here’s a list of some of the best crypto brokers to check out.

