Bearish view
- Sell the GBP/USD pair and set a take-profit at 1.2580.
- Add a stop-loss at 1.2725.
- Timeline: 1-2 days.
Bullish view
- Set a buy-stop at 1.2645 and a take-profit at 1.2735.
- Add a stop-loss at 1.2580.
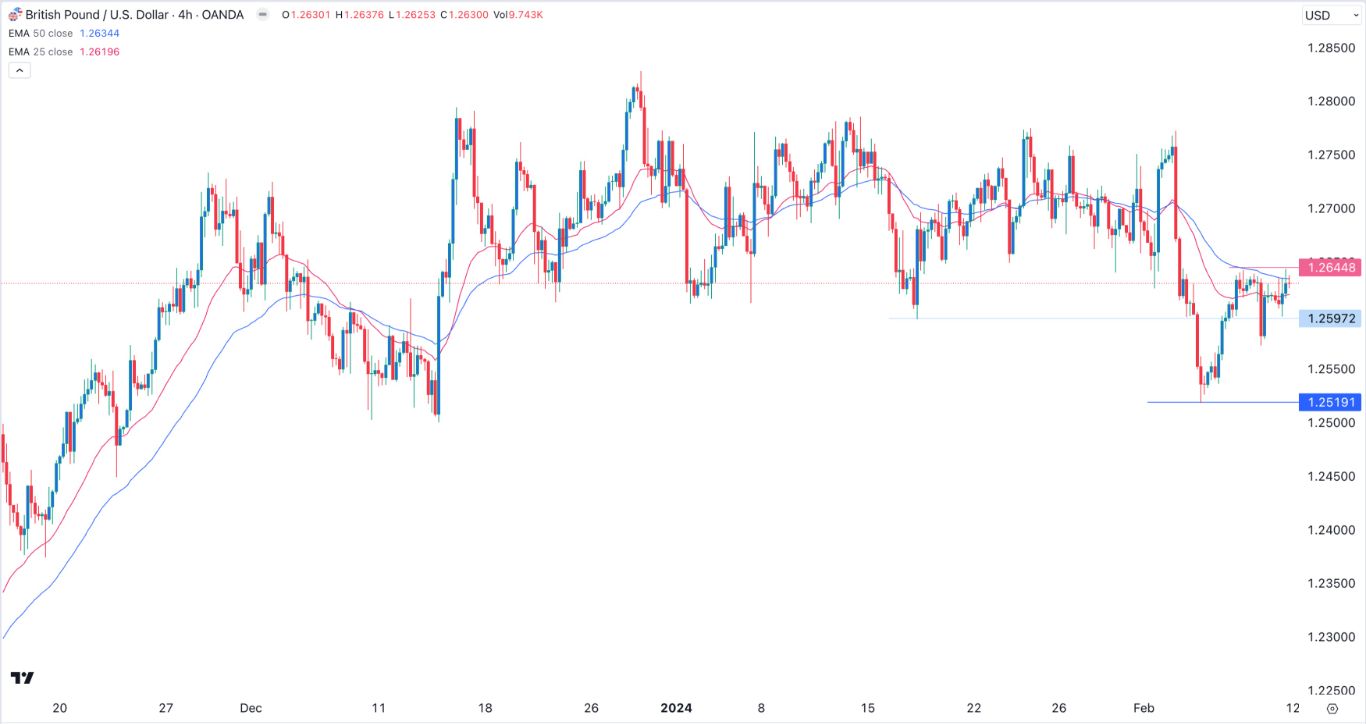
The GBP/USD exchange rate was flat on Monday morning ahead of crucial US and UK inflation numbers. The pair was trading at 1.2630, much higher than February’s low of 1.2520. This price is about 1.55% below the YTD high.
UK and US inflation data ahead
This will be an important week for the GBP/USD pair as the UK and the US publish their January inflation figures. The US will go first on Tuesday while the UK will release its report on Tuesday. These are important figures because they are watched closely by central banks.
The general view is that inflation continued rising but at a slower pace in January. In the US, economists expect the data to show that the headline CPI rose by 2.9% after rising by 3.4% in the previous month. It will be the first time in months that the US inflation came in below 3%.
Top Forex Brokers
There are signs that inflation has eased in the past few months since gasoline prices have not moved a lot recently. The key challenge is that housing costs are rising, with rental prices rising in most states because of low inventories and high demand.
Lower-than-expected inflation report will increase the probability that the Fed will cut interest rates in the first half of the year. A higher report coupled with this month’s strong non-farm payrolls (NFP) will mean that the Fed will want to wait for longer before starting to cut.
In the UK, economists expect that the headline inflation dropped by 0.3% in January, leading to a YoY increase of 4.1%. It increased by 0.4% MoM and 4.0% YoY in the previous month. Core inflation is expected to come in at 5.2%. Like in the US, the main challenge in the UK is that house prices have continued rising in the past few months.
GBP/USD technical analysis
The GBP/USD pair has bounced back after bottoming at 1.2520, its lowest point on February 15. It has moved above the key resistance point at 1.2597, its lowest swing on January 17th. The pair has moved slightly above the 50-period moving average.
However, the pair has formed a double-top pattern at 1.2645. In most periods, this pattern is one of the most popular bearish signs. Therefore, the pair will likely have a bearish breakout ahead of the UK and US inflation data. The alternative scenario is where the pair rises to the key resistance point at 1.2700.
Ready to trade our free daily Forex trading signals? We’ve shortlisted the best UK forex broker in the industry for you.


