Fundamental Analysis & Market Sentiment
I wrote on 28th January that the best trade opportunities for the week were likely to be:
- Long of the NASDAQ 100 Index following a daily close above 17686. This did not set up.
- Long of the S&P 500 Index. This produced a weekly gain of 1.38%
- Long of Cocoa Futures following a daily close above 4840. This set up at close on Thursday and produced a weekly gain of 1.07%.
The overall result was a gain of 2.45% which comes to a gain of 0.82% per asset.
Last week again saw very low directional volatility in the Forex market, with only one significant currency pair fluctuating by more than 1%. There was important action in stock markets, especially in the US and Japan. Last week again saw new all-time high prices reached by the benchmark S&P 500 Index and the Nasdaq 100 Index.
This rise in stock markets occurred despite the CME’s FedWatch tool showing strongly lowering expectations of a March rate cut by the Federal Reserve. Markets now see only a 38% chance of a rate cut in March, down from 46% one week ago, after the Fed stated that a rate cut at its next meeting in March would be “unlikely”.
Last week's agenda was dominated by the policy meetings of the Federal Reserve, as well as the Bank of England, with the BoE delivering no real surprises. However, there were two US data items, JOLTS Job Openings and CB Consumer Confidence, which seemed to have real effects on sentiment, as both showed the US economy performing more strongly than expected. Yet it was the huge non-farm payrolls number on Friday and average hourly earnings that really set the tone, as each came in almost twice as strong as expected, showing a US economy that still seems to be running somewhat hot despite falling inflation. Especially notable was average hourly earnings rising by 0.6% month-on-month.
The Forex market was dominated by a strong US Dollar while the Australian Dollar was the weakest major currency, although the numbers were quite small so maybe not very meaningful. The US Dollar is showing some short-term bullish momentum but has no real long-term trend and is prone to consolidation.
There were several other important economic data releases last week:
- US Revised UoM Consumer Sentiment – came in roughly as expected.
- Australian CPI (inflation) – came in lower than expected, showing a fall to 3.4% and sending the Aussie lower.
- Canadian GDP – slightly higher than expected.
- Chinese Manufacturing PMI – came in roughly as expected.
- US ISM Manufacturing PMI – stronger than expected, adding weight to the hot US economy sentiment.
- US Employment Cost Index – slightly lower than expected.
- US Unemployment Claims – very slightly higher than expected.
The Week Ahead: 5th – 9th February
The most important items over the coming week will probably be the Reserve Bank of Australia’s policy meeting and the interview with Fed President Jerome Powell not long after markets open in Asia. However, overall next week has a light schedule, and there will be little else going on.
Other major economic data releases this week will be, in likely order of importance:
- US ISM Services PMI
- Governor of Bank of Canada Speaks
- New Zealand Unemployment Rate
- US Unemployment Claims
- RBA Governor Testimony Before Parliament
- Canadian Unemployment Rate
Tuesday will be a public holiday in New Zealand (Waitangi Day).
Top Forex Brokers
Monthly Forecast February 2024

For the month of February, I make no monthly forecast, as there is no obvious long-term trend in the US Dollar that can be relied upon.
The performance of my forecast last month for January was unfortunately negative:

Weekly Forecast 4th February 2024
Last week, I made no weekly forecast, as there were no strong counter-trend price movements in any currency crosses, which is the basis of my weekly trading strategy.
I again make no forecast this week.
Directional volatility in the Forex market remained the same last week with only 4% of the most important currency pairs fluctuating by more than 1%. Volatility is likely to increase over the coming week, as such a low level of volatility is unusual for more than a week or two.
Last week saw relative strength in the Swiss Franc, and relative weakness in the Euro.
You can trade these forecasts in a real or demo Forex brokerage account.
Key Support/Resistance Levels for Popular Pairs
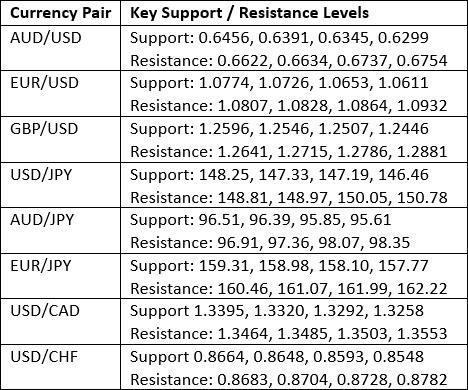
Technical Analysis
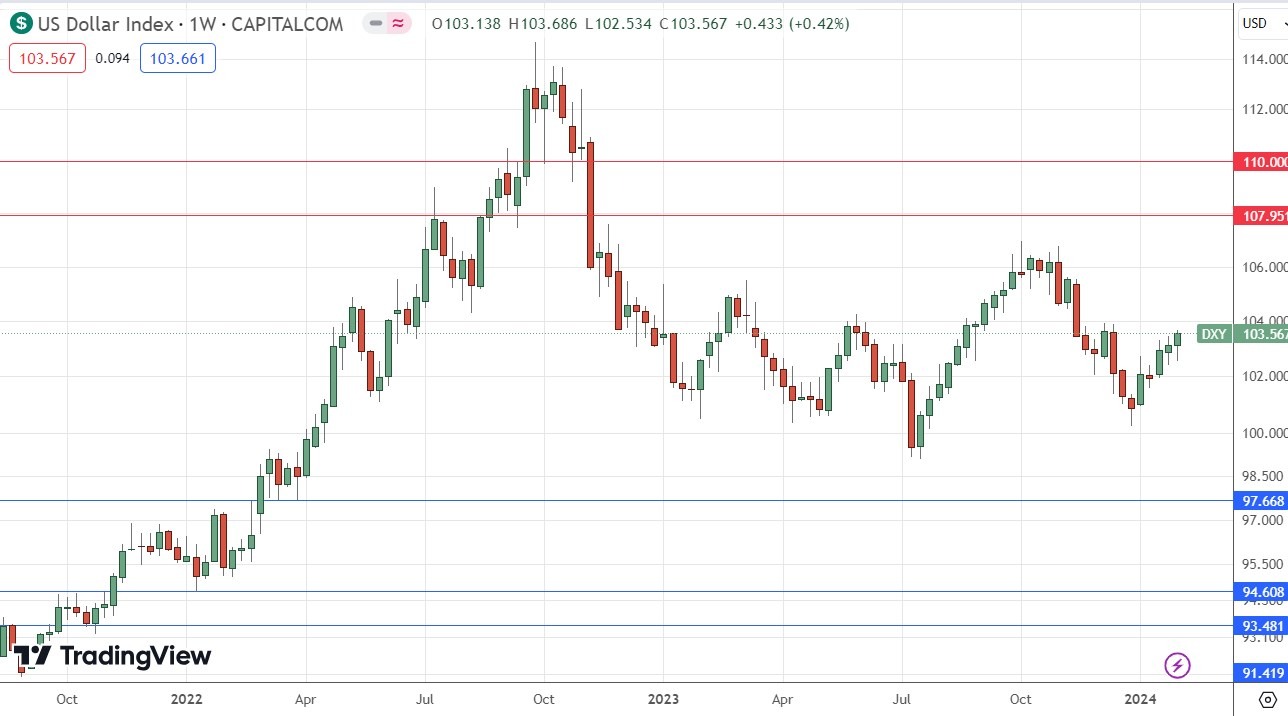
US Dollar Index
The US Dollar Index printed a bullish candlestick last week, which displays some bullish momentum but nothing very dramatic. The weekly close was down on the price of 3 months ago but up on the price of 6 months ago, presenting a mixed long-term trend.
Due to this mixed technical picture, I cannot take a position on the US Dollar as a trend trader, so trading Forex this week it will probably be best to take a short-term, opportunistic approach based upon day-to-day sentiment, while relying on strength or weakness in other currencies beyond the greenback. Having said that, we do see a short-term bullish trend in the greenback which is supported by declining expectations of rate cuts soon from the Federal Reserve, so there may be a case for looking for long USD trades this week.
NASDAQ 100 Index
The NASDAQ 100 Index rose last week after dipping to briefly reach a new all-time high after printing a bullish candlestick. However, for the second week running, the broader S&P 500 Index made a more bullish weekly close than the NASDAQ 100 did.
The technical picture is bullish long-term, but we have certainly seen some short-term profit taking in tech. There are good reasons to hold a long position open in the bull market we are currently in, but the price may have to drop a bit further before it will start to rise convincingly again into the territory of fresh highs. However, the price did end the week quite bullishly, so it might just make a quick bullish breakout.
I will be happy to enter a new long trade if we get a daily close above 17686.

S&P 500 Index
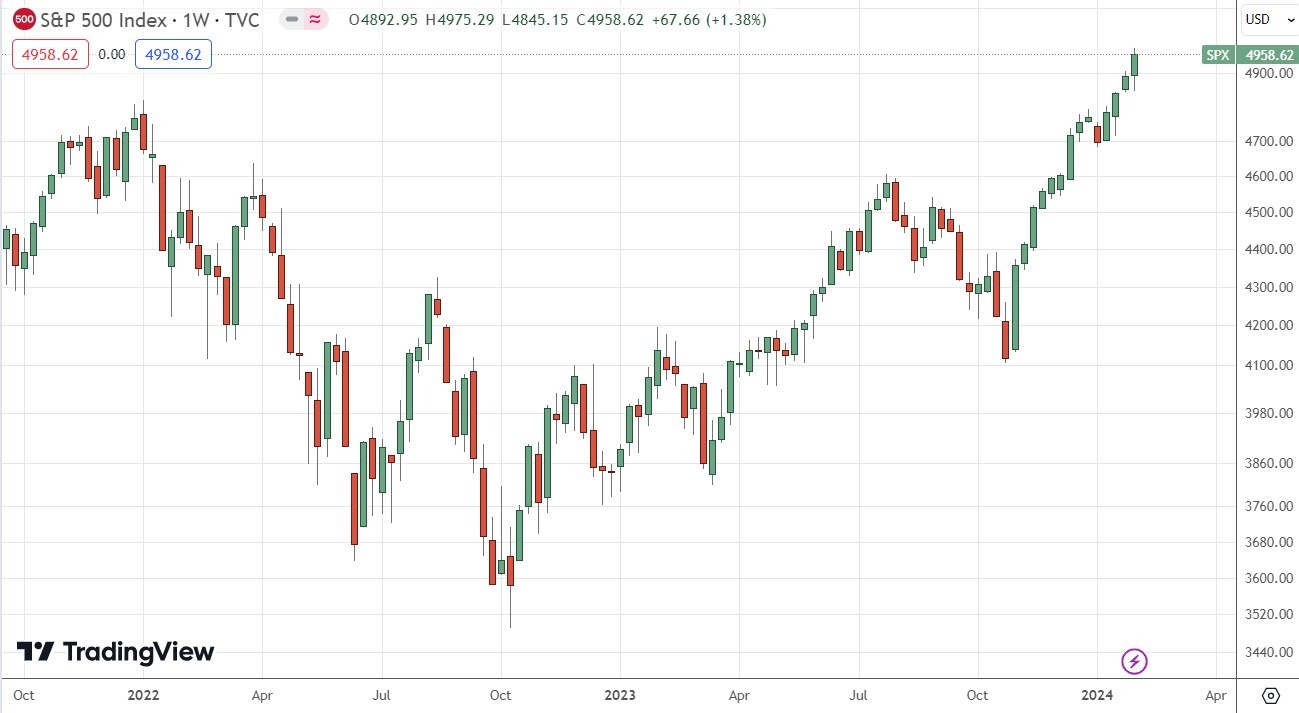
The S&P 500 Index rose again last week to reach and close at new all-time highs. The new record high made two weeks ago was the first time this has happened in two years.
The weekly candlestick is of an average size and closed quite near its high, which is a bullish sign. It is a notably more bullish close than we saw in the NASDAQ 100 Index.
This bullishness in US stock markets is a little strange as it comes at the same time as short-term US treasury yields and the US Dollar are rising in value, while expectations of a rate cut by the Federal Reserve in March are continuing to fall even lower after last week’s Fed policy meeting. These factors typically weaken US stock markets. It may be that the US economy is just looking so much more impressive than its competitors right now, that an inflow of foreign investment is coming into the US stock market. This will likely have been reinforced by the far stronger than expected US non-farm payrolls data released last Friday.
I see the S&P 500 Index as a buy.
The technical picture is bullish. A first break to a fresh all-time high has historically generated an advance of a median 13% over the next year, so traders and investors should be seriously considering going long here.
GBP/USD
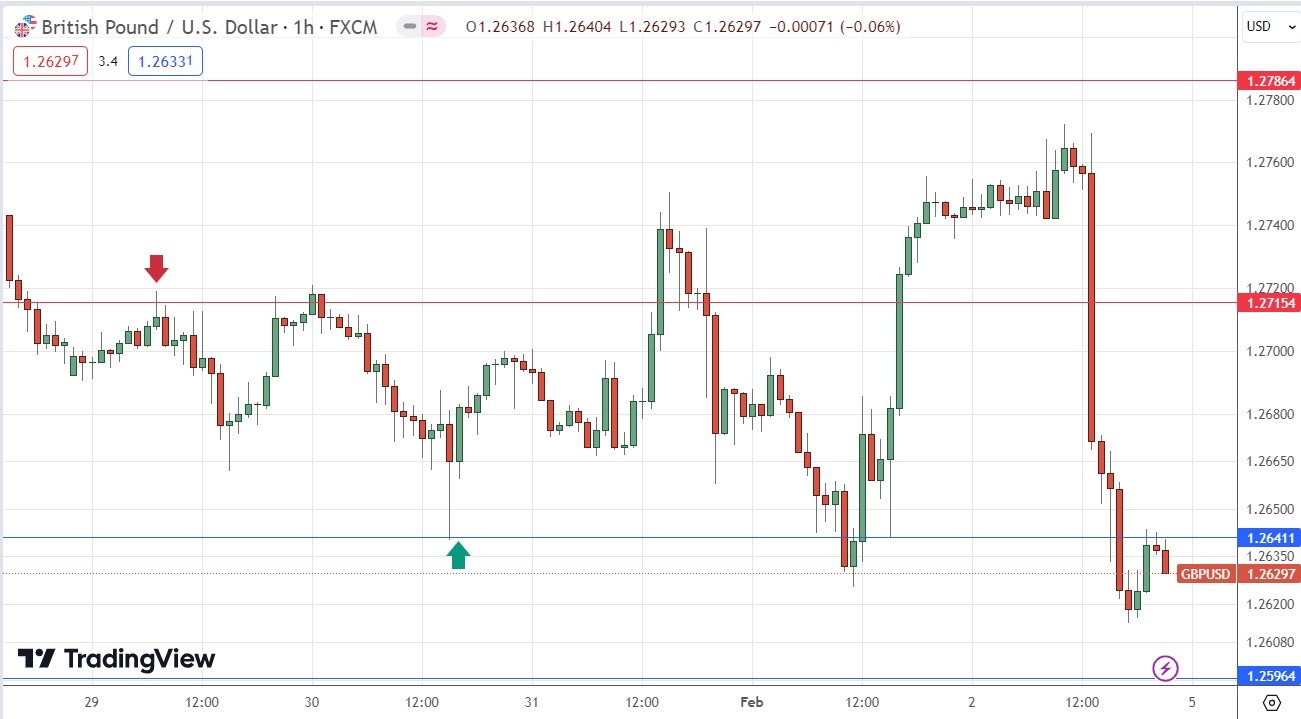
I had expected the level at $1.2641 might act as support and the level at $1.2715 might act as resistance in the GBP/USD currency pair last week, as both prices have acted previously as both support and resistance. Note how these “role reversal” levels can work well. The H1 price chart below shows how the price rejected the resistance level at the start of last Monay’s London session with a pin bar, marked by the down arrow in the price chart below signaling the timing of this bearish rejection. This can be a great time of the day to trade a major Forex currency pair like this one. This trade was profitable, giving a maximum reward to risk ratio of more than 2 to 1. The bullish bounce at the support level at $1.2715 then happened at the end of the London/New York session overlap last Tuesday which can also be a great time to enter new trades, with a bullish engulfing candlestick giving the entry signal. This trade gave a maximum profit greater than a reward to risk ratio of 1 to 1.
USD/JPY
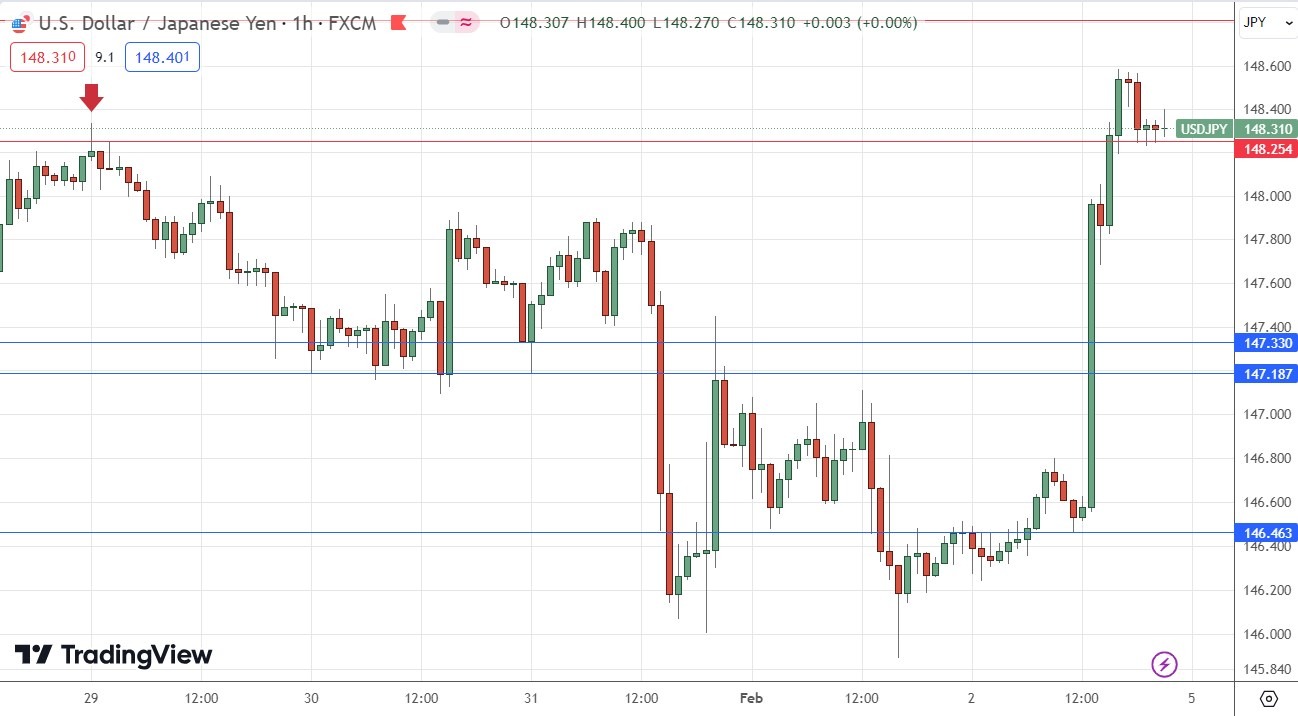
I had expected the level at ¥148.25 might act as resistance in the USD/JPY currency pair last week, as it had acted previously as both support and resistance. Note how these “role reversal” levels can work well. The H1 price chart below shows how the price rejected this level right at the start of last Monday’s Tokyo session with a pin bar, marked by the down arrow in the price chart below signaling the timing of this bearish rejection. This trade was very profitable, giving a maximum reward to risk ratio of more than 11 to 1 based upon the size of the entry candlestick.
Note that ¥148.25 now seems to have become firm support, so if the price opens above it, and then dips to bounce off it again, that could be a good signal for a new long trade in this currency pair.
AUD/USD
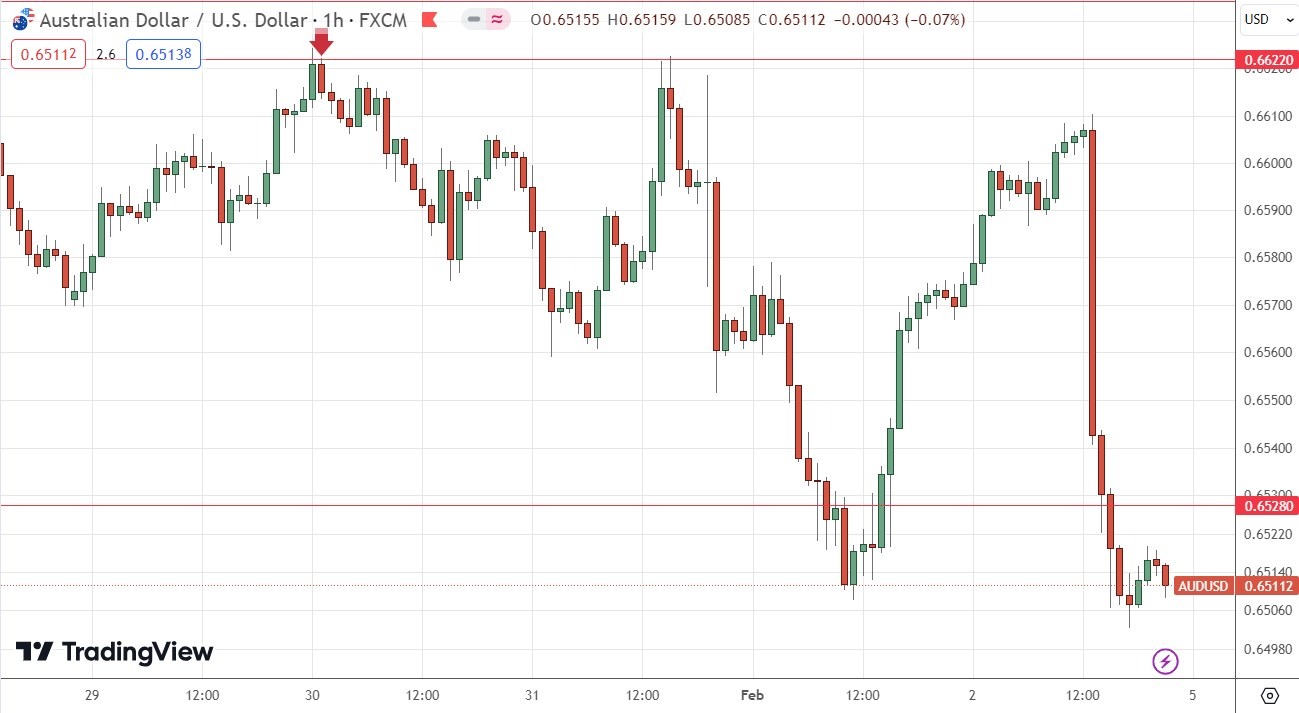
I had expected the level at $0.6622 might act as resistance. The H1 price chart below shows how the price rejected this level right at the start of last Tuesday’s Asian session with an inside bar, marked by the down arrow in the price chart below signaling the timing of this bearish rejection. This trade was very profitable, giving a maximum reward to risk ratio of more than 9 to 1 based upon the size of the entry candlestick structure.
The Australian Dollar weakened last week after Australian inflation fell unexpectedly strongly, leading to a firmer expectation of rate cuts by the RBA. This means that the best trades to look for in this currency pair over the coming week will likely be on the short side, so waiting for a rejection of a nearby resistance level could be a great trade. The US Dollar is also showing short-term bullish momentum, which strengthens the case for a short trade here next week.
USD/CAD
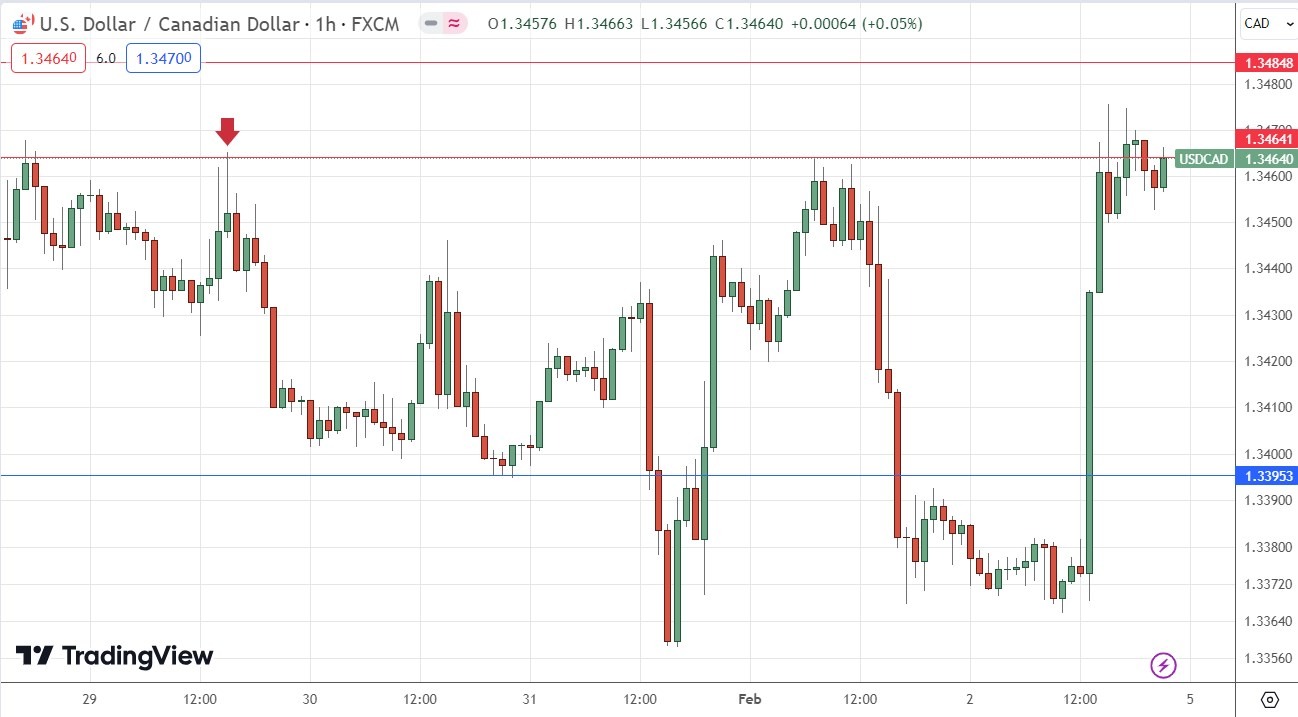
I had expected the level at $1.3464 might act as resistance in the USD/CAD currency pair last week, as it had acted previously as both support and resistance. Note how these “role reversal” levels can work well. The H1 price chart below shows how the price rejected this level during last Monday’s London/New York session overlap with a pin bar, marked by the down arrow in the price chart below. This trade was profitable, producing a maximum reward to risk ratio of more than 3 to 1.
EUR/JPY
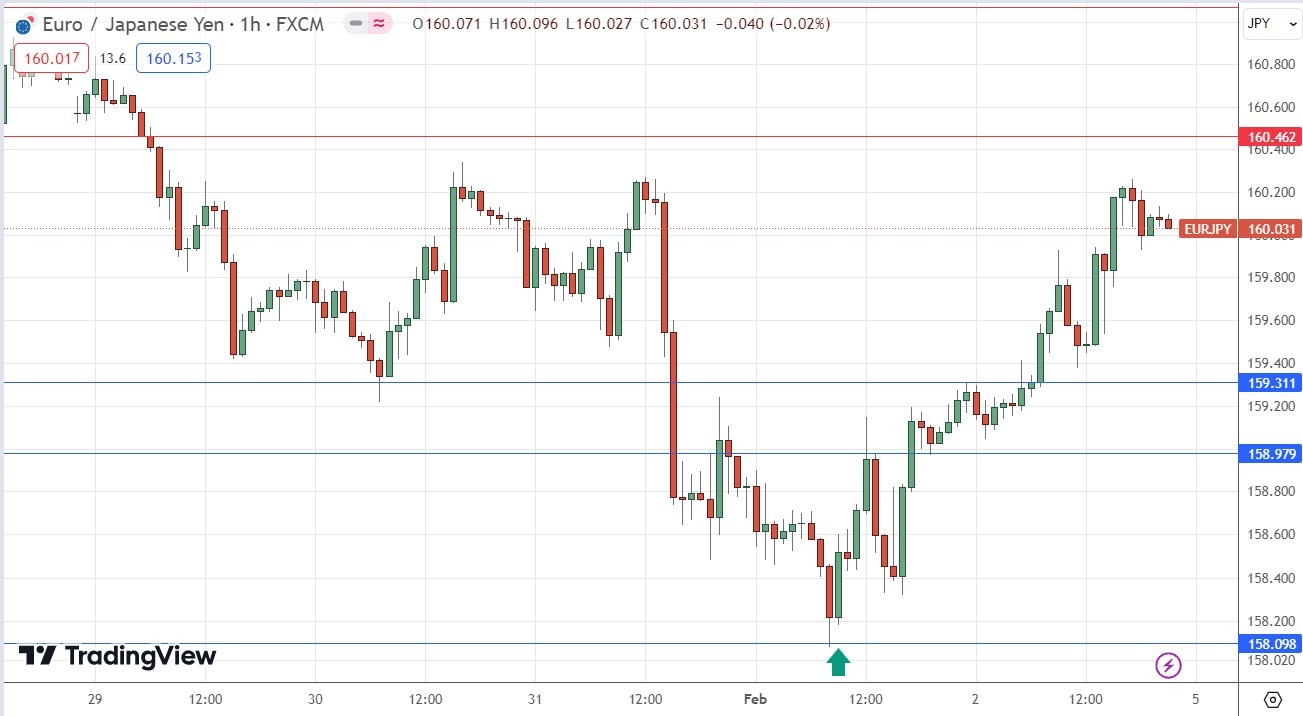
I had expected the level at ¥158.10 might act as support. The H1 price chart below shows how this level was rejected during last Thursday’s London session, marked by the up arrow in the price chart below signaling the timing of this bullish rejection. This trade has been profitable, giving a maximum reward to risk ratio of more than 2 to 1 based upon the size of the entry candlestick structure.
Note that the Euro is showing some relative strength, and this currency pair is in a long-term bullish trend, so it may be wise to look for a long trade from a bounce off any nearby support level over the coming week.
Cocoa Futures
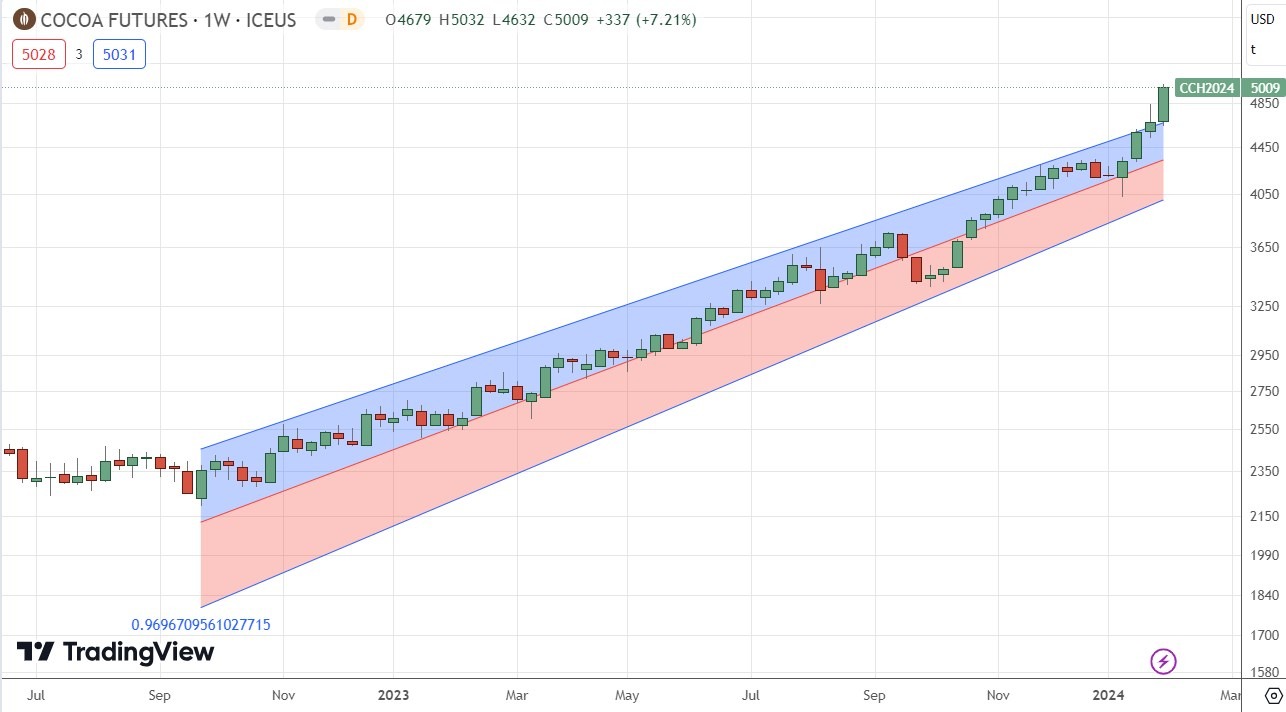
Cocoa futures have been in a strong bullish trend for over a year and last week the price advanced very strongly to reach a new multi-year high price, closing near its high just above the big round number at 5000. The price chart below applies linear regression analysis to the past 72 weeks and shows graphically what a great opportunity this has been on the long side over the long term.
Despite the recent sharp dip, this strong trend shows no true sign of stopping. There is an ever-increasing global demand for this superfood cocoa and supply has been stretched over recent months.
Trading commodities long on breakouts to new 6-month highs has been a very profitable strategy over recent years, so I see this as a buy. However, it is worth noting that the price is well outside the linear regression channel, so it may be worth waiting for a breakout to a new high to be sure this retracement is over.
Bottom Line
I see the best trading opportunities this week as:
- Long of the NASDAQ 100 Index following a daily close above 17686.
- Long of the S&P 500 Index.
- Long of Cocoa Futures.
- Long of USD/JPY and/or EUR/JPY following a bullish bounce at key support.
- Short of AUD/USD following a bearish rejection at key resistance.
Ready to trade our weekly Forex analysis? We’ve made a list of the best brokers to trade Forex worth using.
