Bullish view
- Buy the BTC/USD pair and set a take-profit at 72,000.
- Add a stop-loss at 68,000.
- Timeline: 1-2 days.
Bearish view
- Set a sell-stop below 68,500 and a take-profit at 67,500.
- Add a stop-loss at 72,000.
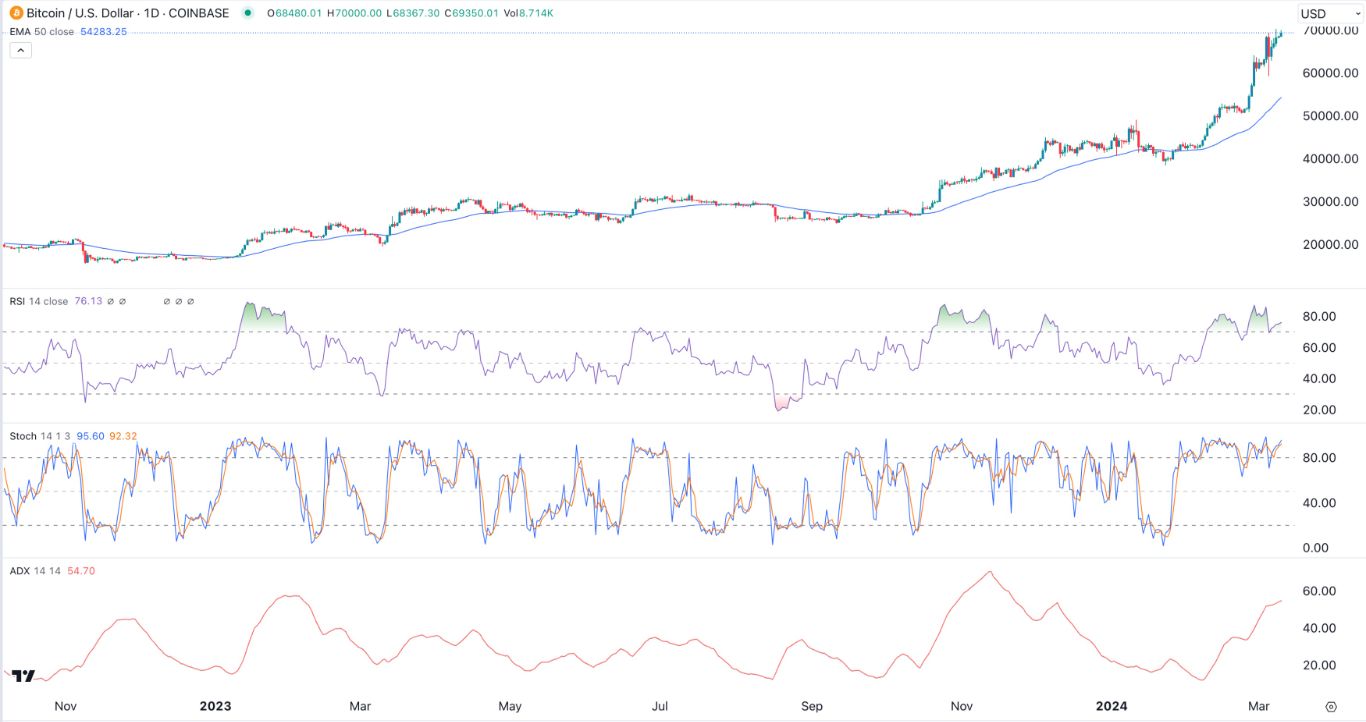
Bitcoin continued its spectacular comeback, soaring to a record high last week. The BTC/USD pair crossed the important resistance point at 70,000 last week, capping a strong rally that started 15 years ago when it was trading below $1.
Bitcoin supply issues
The main reason why Bitcoin price has soared sharply recently is that there is an ongoing supply and demand imbalance in the industry.
Bitcoin supply has been growing gradually as minors added about 900 coins to the market every day. This supply growth will slowdown sharply in April once Bitcoin goes through the halving event.
Demand, on the other hand is rising, as evidenced by the performance of ETFs. The latest data shows that the iShares Bitcoin ETF (IBIT) has added over $13 billion in assets in the past two months.
Fidelity’s Wise Origin Bitcoin ETF (FBTC) has over $6.4 billion in assets while the ARK 21Shares Bitcoin ETF has over $1.52 billion in assets. Other funds by companies like Franklin Templeton and Bitwise have also continued to add substantial assets recently.
Top Forex Brokers
Analysts believe that this trend could see Bitcoin’s assets move above those of gold in the coming months.
The difference between gold and Bitcoin is that the former has unlimited supply. While gold’s supply in mines has dropped, a big find cannot be ruled out. Bitcoin’s supply, on the other hand, is capped at 21 million.
The BTC/USD pair has also jumped as the Federal Reserve hinted that it could start cutting rates in the coming months. Besides, inflation has stabilised while the economic growth has slowed.
The most recent data showed that the PCE inflation figure dropped to 2.4% in February while the core PCE came in at 2.8%. This means that the figures could drop to 2.0% in the coming months.
BTC/USD technical analysis
The BTC/USD pair continued its strong rally this week as demand rose. It has moved above the psychological point of 70,000. This means that Bitcoin has risen above all moving averages and the Ichimoku cloud.
The Average Directional Index (ADX) has risen above 50 while the Relative Strength Index (RSI) and the Stochastic Oscillator have risen above the overbought point. Therefore, the path of the least resistance for the price of Bitcoin is higher, with the next level to watch being at 72,000.
Ready to trade our free Forex signals? Here are the best MT4 crypto brokers to choose from.


