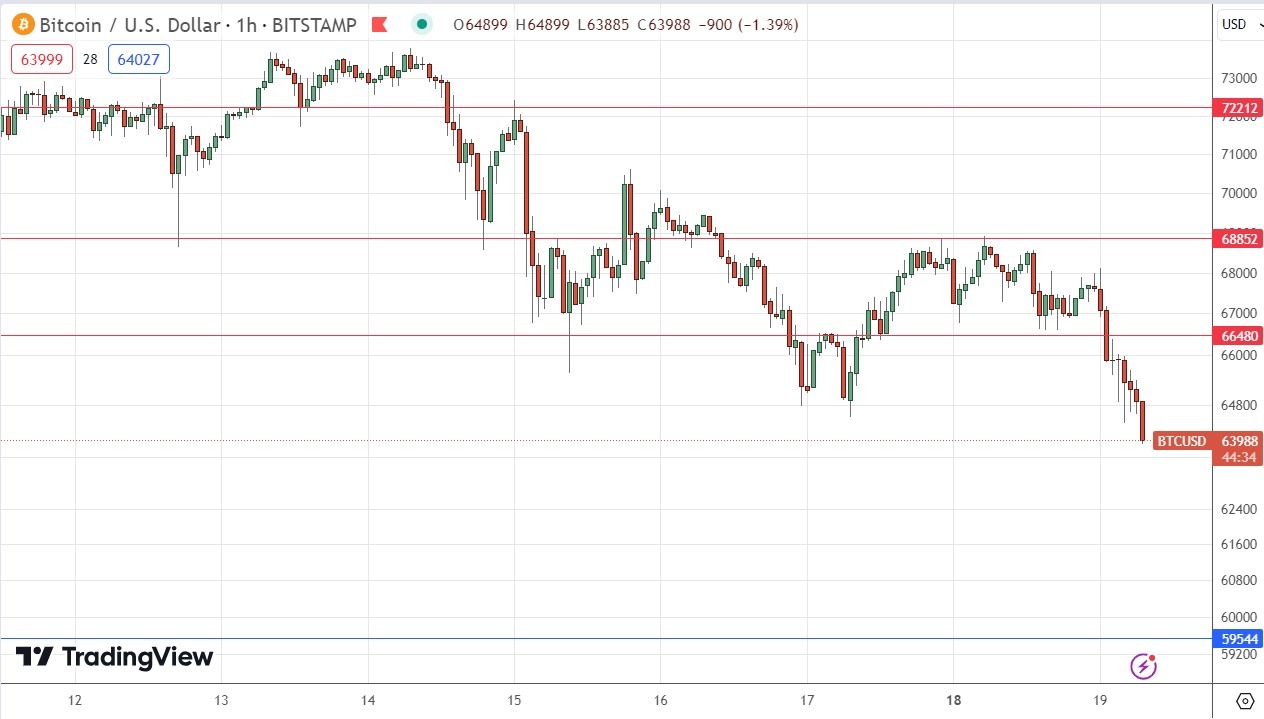
My previous BTC/USD signal on 13th March was not triggered as none of the key support or resistance levels were hit that day.
Today’s BTC/USD Signals
- Risk 0.75% per trade.
- Trades may only be taken prior to 5pm Tokyo time Wednesday.
Long Trade Idea
- Long entry after a bullish price action reversal on the H1 timeframe following the next touch of $59,544.
- Place the stop loss $100 below the local swing low.
- Adjust the stop loss to break even once the trade is $100 in profit by price.
- Remove 50% of the position as profit when the trade is $100 in profit by price and leave the remainder of the position to run.
Short Trade Ideas
- Short entry after a bearish price action reversal on the H1 timeframe following the next touch of $66,480, $68,852, or $72,212.
- Place the stop loss $100 above the local swing high.
- Adjust the stop loss to break even once the trade is $100 in profit by price.
- Remove 50% of the position as profit when the trade is $100 in profit by price and leave the remainder of the position to run.
The best method to identify a classic “price action reversal” is for an hourly candle to close, such as a pin bar, a doji, an outside or even just an engulfing candle with a higher close. You can exploit these levels or zones by watching the price action that occurs at the given levels.
Top Forex Brokers
BTC/USD Analysis
I wrote in my previous BTC/USD analysis last Wednesday that we were seeing some bullish short-term price action, so there were signs that the price was going to make another record today. I saw two consecutive higher hourly closes above the all-time high of $73,054 as a potentially good entry signal. This gave a long trade entry, but the trade went nowhere, with the price basically unchanged at the end of the day. I was at least correct about the price rising to make a new record high.
The technical picture is now considerably more bearish as the price continues to fall away from the record high last week. The short-term price action is notably bearish, and there are no obvious support levels below until $60,000 is reached. We are seeing consecutive lower candlesticks on the hourly chart, and I think that if this bearish pattern continues, we are likely to see the price fall strongly to the $60,000 area.
I think the best approach today will be to go short on strong bearish momentum, targeting the $60,000 price area.
There is nothing of high importance due today regarding the US Dollar.
Ready to trade our daily Bitcoin signals? Here’s our list of the best Bitcoin brokers worth checking out.


