Bullish view
- Buy the BTC/USD pair and set a take-profit at 68,000.
- Add a stop-loss at 62,000.
- Timeline: 1-2 days.
Bearish view
- Set a sell-stop at 63,500 and a take-profit at 60,000.
- Add a stop-loss at 65,000.
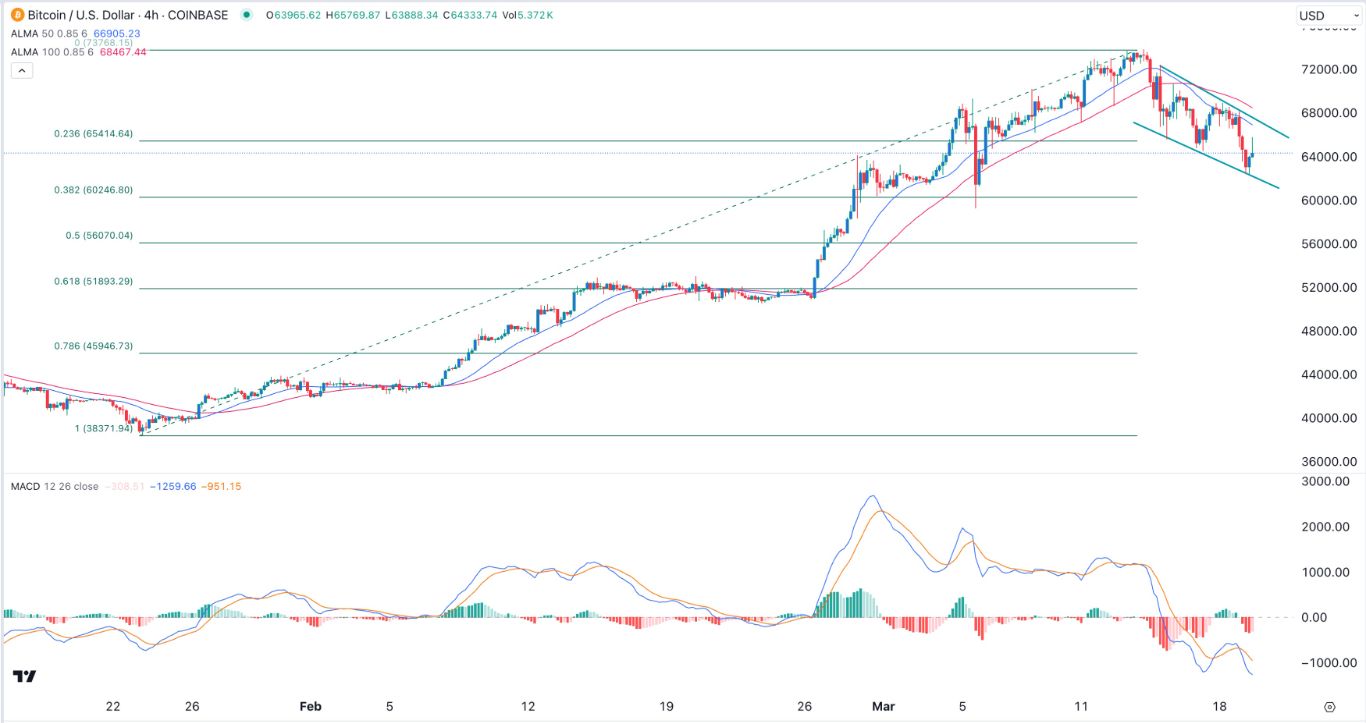
Bitcoin price has been highly volatile this week as some investors started to take profits after the recent spectacular bull run. The BTC/USD pair crashed hard to a low of 62,402 on Tuesday, much lower than the year-to-date high of 73,816.
Profit-taking continues
Bitcoin has been one of the best-performing assets since January 2023 as it jumped from last year’s low of less than $20,000 to a high of $73,000. It has outperformed commodities like gold and silver and American indices like the Dow Jones, Nasdaq 100, and S&P 500 indices.
Bitcoin has faced numerous tailwinds. The Securities and Exchange Commission (SEC) has approved eleven spot Bitcoin ETFs. Recent data shows that these ETFs have seen substantial inflows from institutional investors.
The iShares Bitcoin ETF (IBIT) has added over $15 billion in assets while the Fidelity Wise Origin Bitcoin ETF has more than $6.5 billion. Other Bitcoin ETFs from companies like Ark Invest and Bitwise have also seen substantial inflows.
Top Forex Brokers
These inflows have happened at a time when Bitcoin supply is still falling. The amount of Bitcoin in exchanges has continued falling. Also, the upcoming Bitcoin halving will lead to slow supply growth as the number of daily BTC rewards are slashed in half.
The BTC/USD pair has also retreated as the US dollar index has rebounded ahead of the Federal Reserve decision. The dollar index has jumped to $103.70 as traders place bets that the Fed will deliver a hawkish decision.
Recent data shows that US inflation has been strong in the past few months. The headline inflation stands at 3.1% while core inflation rose to 3.8%. A hawkish Fed may lead to more volatility among risky assets.
Analysts are relatively bullish about Bitcoin. Those at Standard Chartered expect Bitcoin will surge to $150k by the end of the year.
BTC/USD technical analysis
Bitcoin peaked at 73,768 this month and has pulled back sharply recently. On the four-hour chart, the pair has crashed below the 23.6% Fibonacci Retracement level. The 50-period and 100-period Arnaud Legoux Moving Averages (ALMA) have formed a bearish crossover.
It has also formed a descending channel and is now between this channel. The MACD has moved below the neutral point. Therefore, the pair may continue falling in the near term as the current shakeout continues. This could see it drop to the support at 60,000 and then bounce back to 70,000.
Ready to trade our free trading signals? We’ve made a list of the best Forex crypto brokers worth trading with.


