USD/JPY
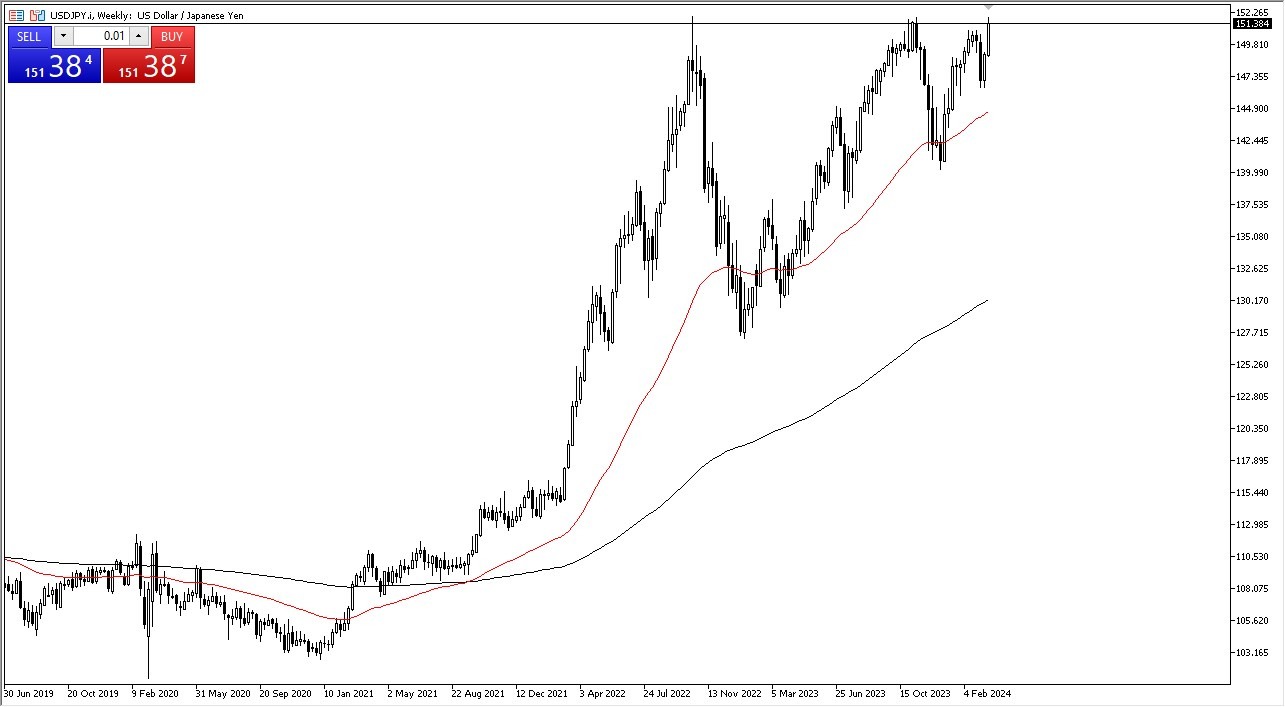
The US dollar has rallied rather significantly against the Japanese yen during the trading week, as we continue to threaten a breakout above the ¥152 level. If we can break above that level, then it is likely that we could go much higher. All things being equal, this is a market that anytime we get a little bit of a pullback, buyers will come back into pickup value. In general, this is a market that I think has much further to go, perhaps to the ¥155 level before it’s all said and done.
Bitcoin
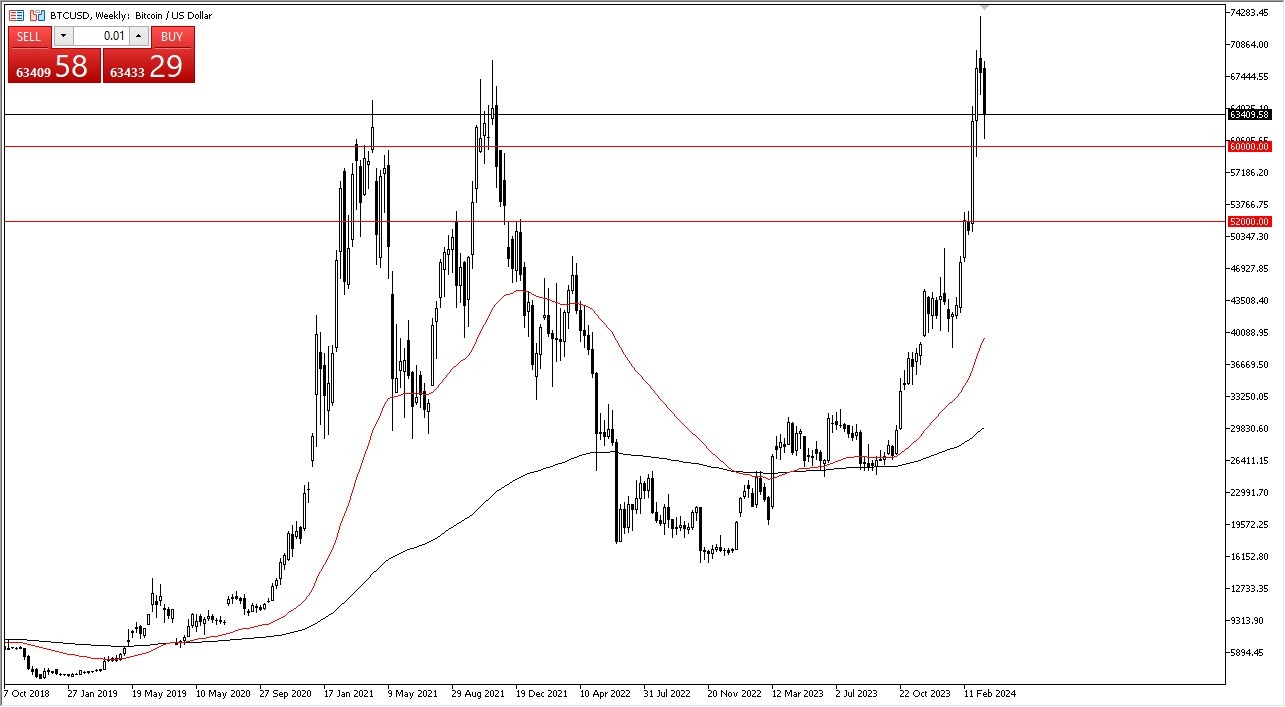
Bitcoin has had a rough week, reaching down toward the $60,000 level. The $60,000 level is an area that is important, and the market has shown that to be the case in the last week. Whether or not we can stay there remains to be seen, but if we were to break down below the $60,000 level, then it is likely that we could pull back to the $52,000 level. All things being equal, this is a market where you have to be either long, or on the sidelines. You cannot be a seller of Bitcoin, and therefore I think you are just looking for short-term opportunities to buy. If we were to break above the shooting star from the previous week, then you could go much higher, watching Bitcoin break well above the $75,000 level.
NASDAQ 100
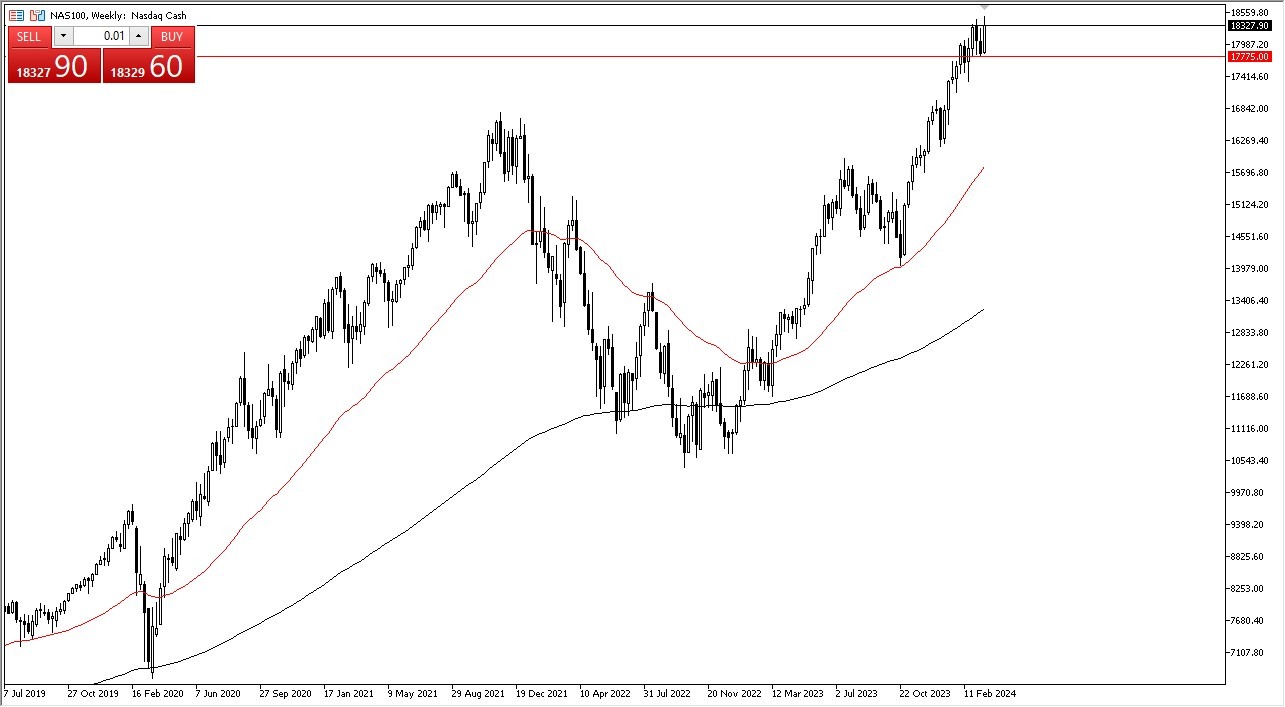
The NASDAQ 100 has been very bullish most of the week, but it was a little lackluster on Friday. All things being equal, the 17,750 level underneath is a significant support level, and therefore I think we have a situation where we continue to go back and forth and try to find value on short-term charts. This is a market that looks like it may do a little bit of consolidation, but that makes sense considering we have been so much in the way of upward momentum. If we can break above the high of this past week, then I think the market is looking to the 19,000 level given enough time, perhaps even as high as the 20,000 level. I have no interest in shorting.
Top Forex Brokers
S&P 500
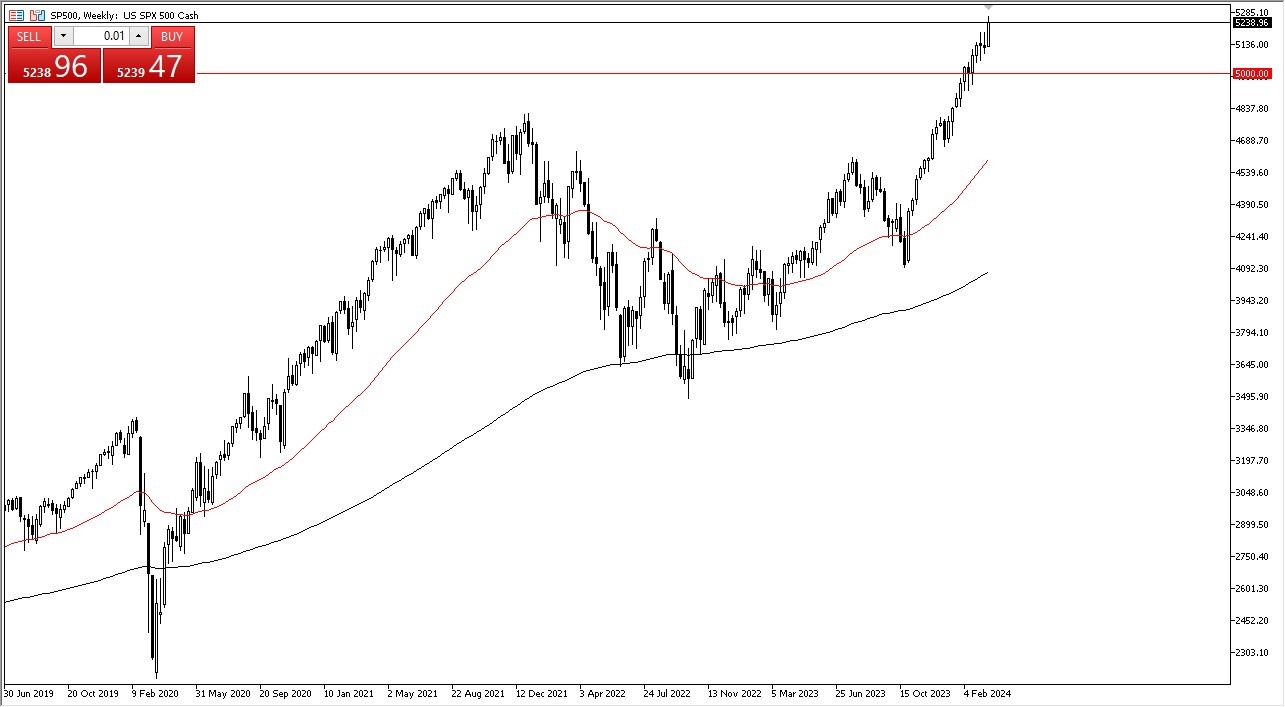
The S&P 500 rallied significantly during the course of the trading week, breaking above the 5200 level. This is a market that every time we pull back, there will be plenty of buyers as it is driven higher by just a handful of stocks, which of course everybody owns. In general, I think this is a market that will continue to go higher as far as I can see, and right now, I believe that the 5000 level underneath is going to continue to be a major floor in the market.
Silver
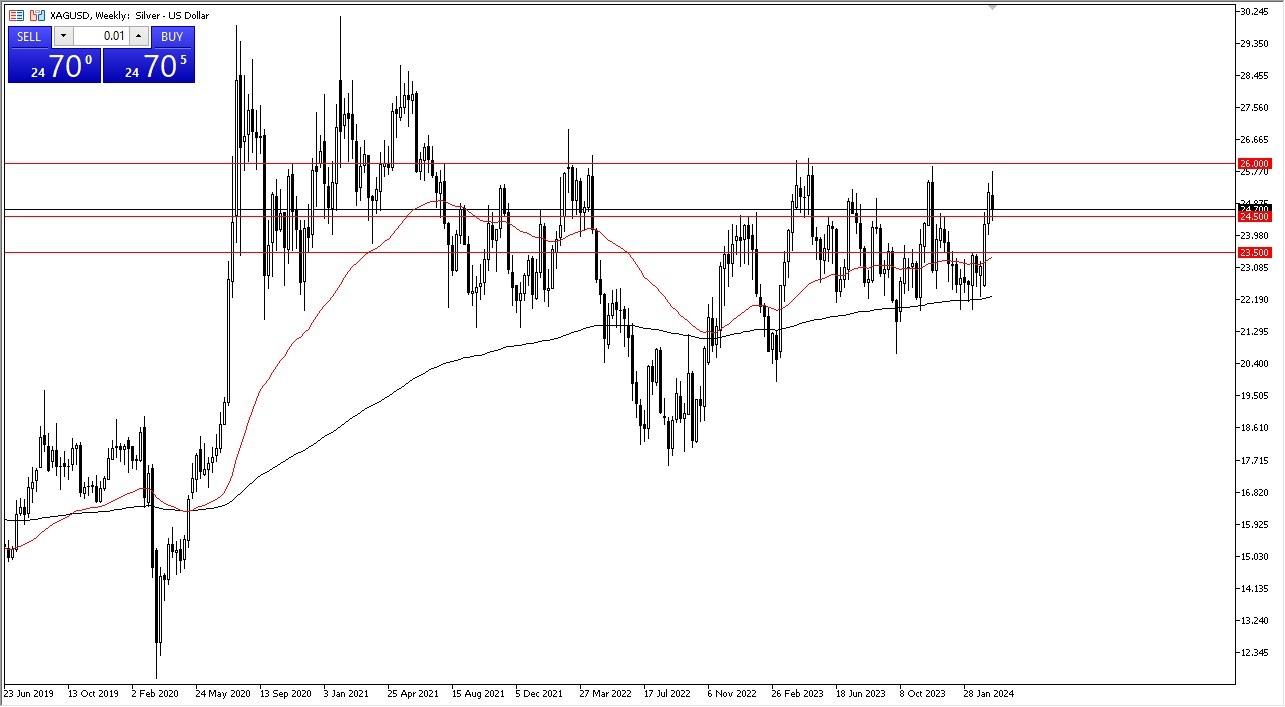
Silver has gone back and forth during the course of the week, reaching higher, falling just shy of the crucial $26 level, and then turned around to fall toward the $24.50 level. This is an area that should continue to offer support, but if we were to break down below there, I think silver could drop down to the $23.50 level. The 50-Week EMA sits just below there, and I think we’ve got massive support in that area. If we were to break above the $26 level, that would be extraordinarily bullish. At this point, it looks like we will probably consolidate with more of a positive attitude that anything else.
WTI Crude Oil (US Oil)
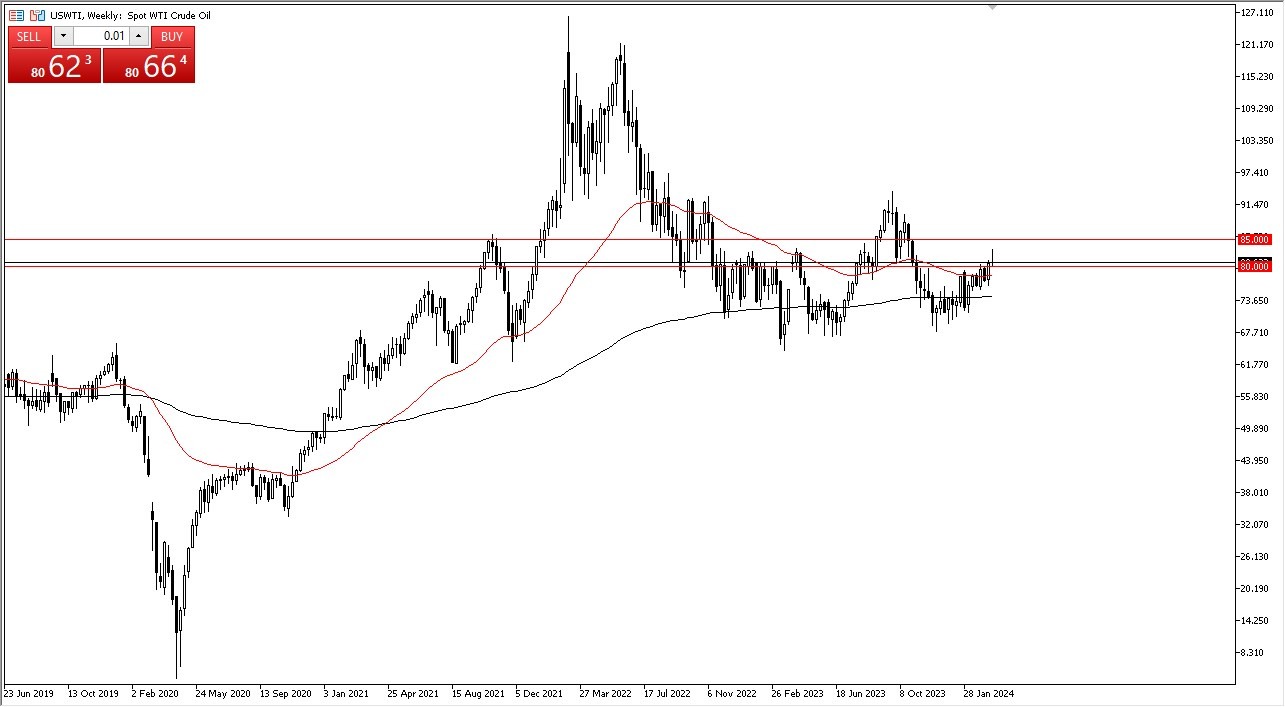
The West Texas Intermediate Crude Oil market rallied significantly during the week but gave back most of the gain. At this point in time, we are now testing the $80 level, which is an area that previously had been massive resistance. It should now be support, and I think a lot of people are willing to jump in and start buying oil in this general vicinity. If we can break above the top of the weekly candlestick, then it’s likely that the crew on market could go looking to the $85 level.
Gold
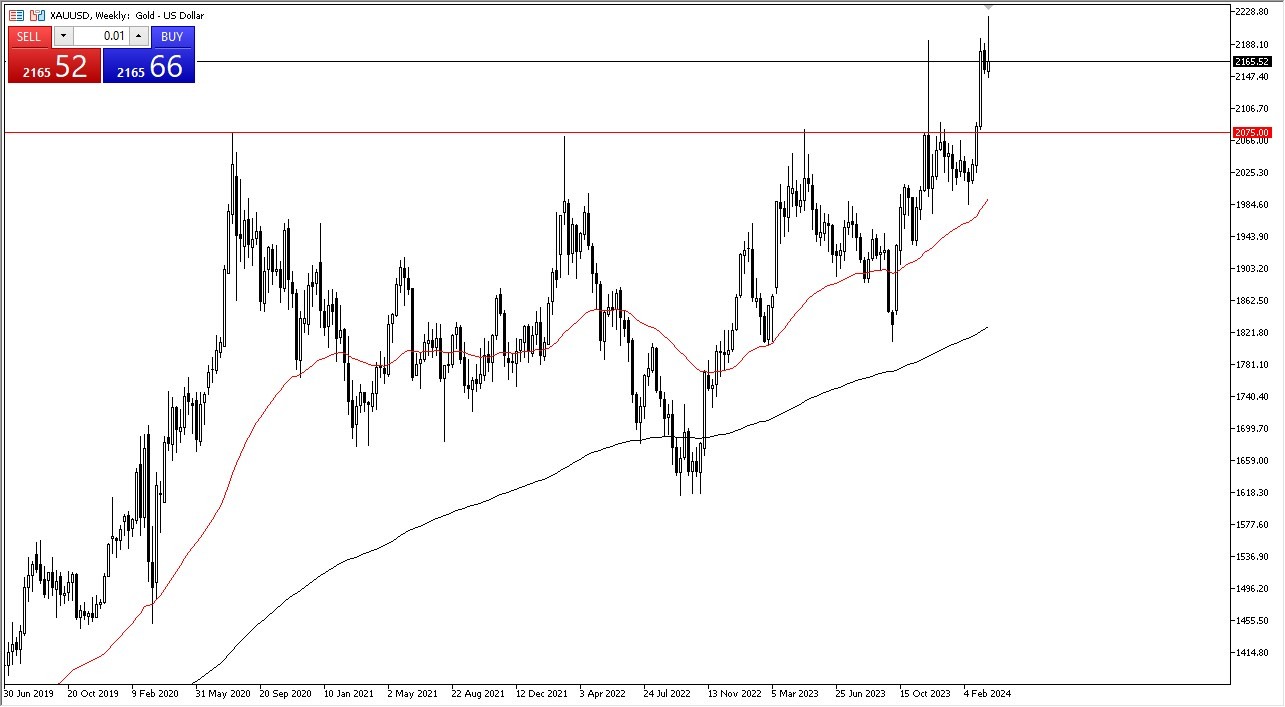
Gold markets initially shot higher during the course of the week, especially in reaction to the Federal Reserve announcement. That being said, the market then gave back a lot of the gain to show signs of hesitation and ended up forming a bit of a shooting star. This shooting star of course is a scenario that could bring in more pulling back and therefore a move back down toward the $2075 level. That being said, I think that’s a “hard floor“ in the market. In general, I think this remains a “buy on the dips” type of market at this point.
DAX
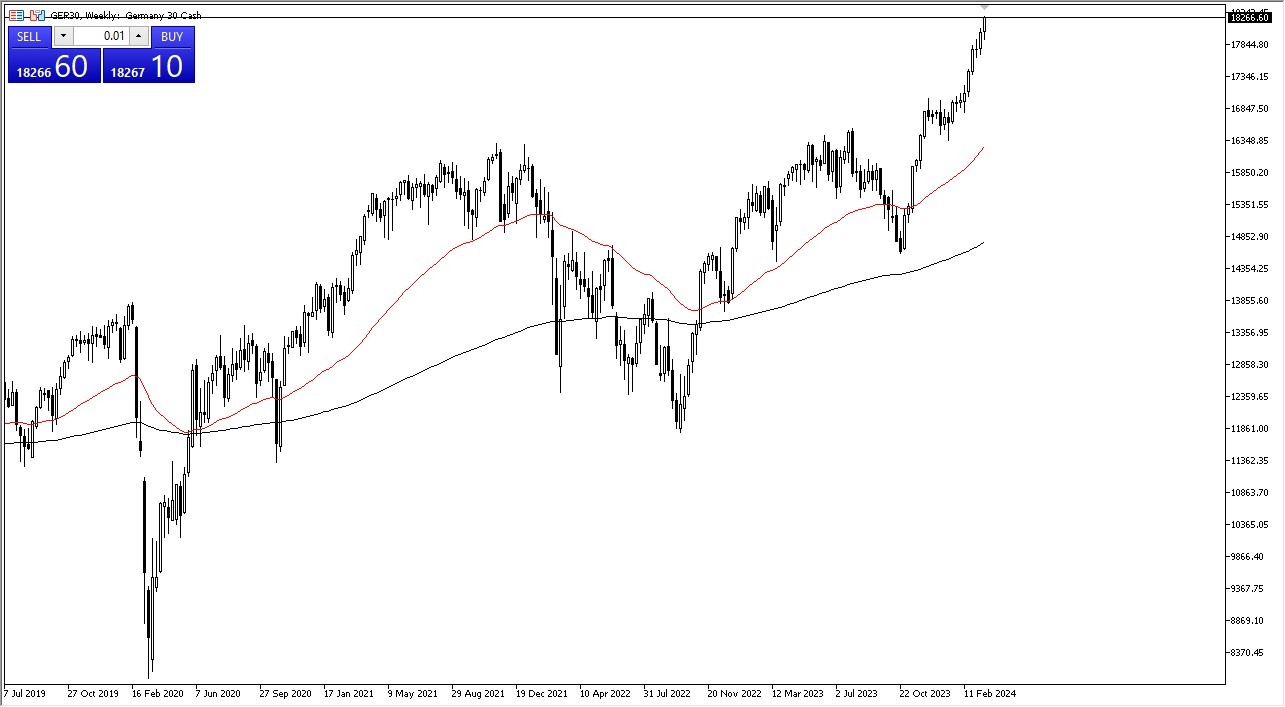
The German index initially pullback during the course of the week, only to turn around and show signs of strength again. This is an index that I think is ready to take off to the upside and continue to go much higher. The €18,500 level is an area that I think people will be looking to get to. Short-term pullbacks offer value, and I think the €17,750 level offers a significant amount of support.
Ready to trade our Forex weekly forecast? Here’s a list of some of the best Forex trading platforms to check out.
