Bullish view
- Buy the AUD/USD pair and set a take-profit at 0.6480.
- Add a stop-loss at 0.6400.
- Timeline: 1-2 days.
Bearish view
- Set a sell-stop at 0.6440 and a take-profit at 0.6375.
- Add a stop-loss at 0.6500.
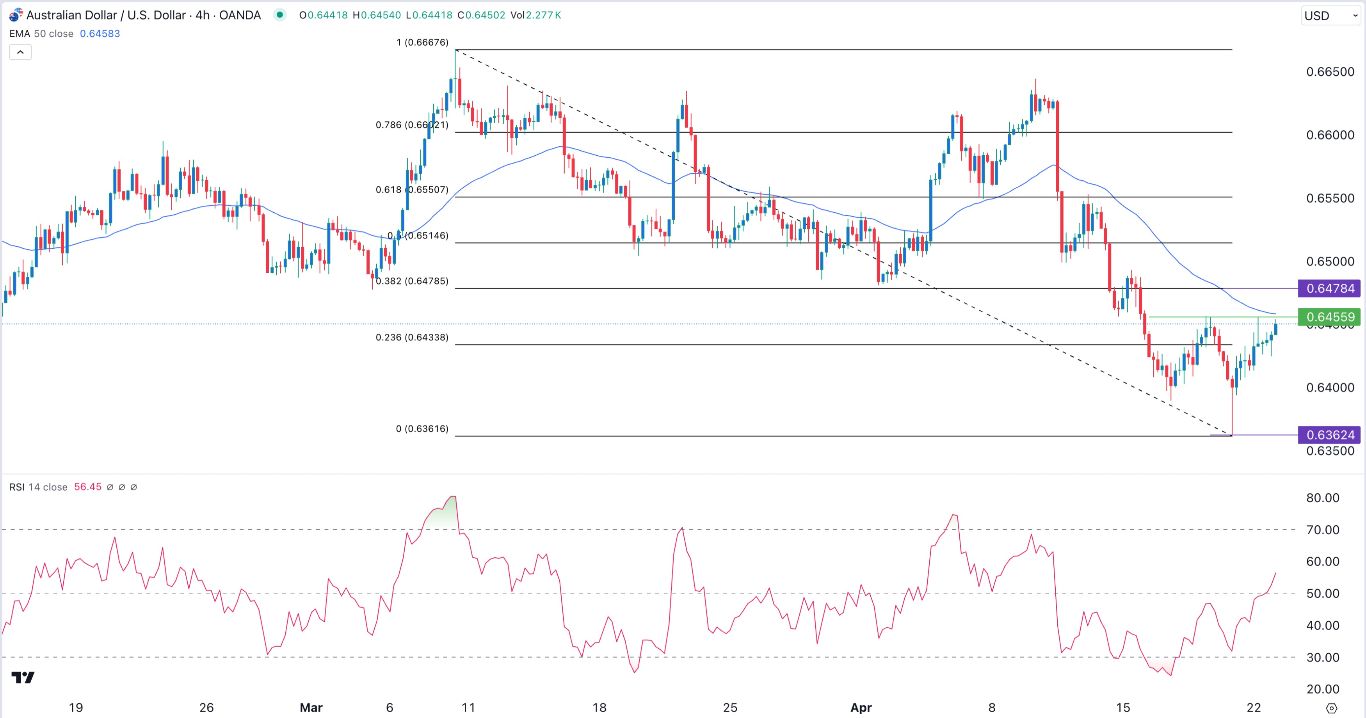
The AUD/USD exchange rate continued its recovery this week as global risks eased, triggering a risk-on sentiment. The pair jumped to a high of 0.6450 on Tuesday, a remarkable rebound from last week’s low of 0.6362.
Geopolitical risks have eased
There is a sense that global risks are easing, which is a positive sign for the Australian dollar. That is evidenced by the performance of crude oil. Brent, the global benchmark, dropped from last week’s $92 to $87. The West Texas Intermediate (WTI) has moved to $82.
This performance accelerated after Israel launched a limited attack on Iran last week. The view is that the tit-for-tat actions by the two sides have ended, which could push oil prices downwards in the next few weeks.
Other commodities have also pulled back, erasing some of the gains made earlier this month. Gold has dropped to $2,340 while the price of copper and silver has moved to $4.5 and $27.26, respectively.
Top Forex Brokers
Therefore, the AUD/USD has risen because of the weaker dollar. The dollar index retreated from last week’s high of $106.20 to a low of $106.
Looking ahead, the next important events will be the upcoming US flash manufacturing and services numbers for April. Economists believe that the figures will come above 50, signaling that the economy continued recovering during the month.
These numbers will be followed by the first estimate of US GDP numbers scheduled for Thursday. Economists expect the data to show that the economy expanded by more than 2% in the first quarter.
If this is correct, it will be the seventh quarter that the economy has grown by over 2%. This performance is mostly because of the trillions of dollars that have been invested in the economy. Biden’s administration has allocated funds through its pandemic stimulus funds, the Inflation Reduction Act (IRA), and the CHIPS Act.
AUD/USD technical analysis
The AUD/USD exchange rate has bounced back in the past few days. This rebound happened after the pair formed a hammer pattern, which is a positive sign. It has also formed an inverse head and shoulders pattern. It has moved to the neckline of this pattern.
The pair has also rebounded above the important 23.6% Fibonacci Retracement level. At the same time, the Relative Strength Index (RSI) has moved above the neutral point of 50. The same is true with the Stochastic Oscillator and the CCI indicators.
The pair has remained slightly below the 50-period Exponential Moving Average (EMA). Therefore, a break above the crucial resistance at 0.6455 will point to more upside, with the next point to watch being the 38.2% retracement at 0.6480.
Ready to trade our daily Forex signals? Here’s a list of some of the best Forex platforms Australia to check out.


