Bearish view
- Sell the BTC/USD pair and set a take-profit at 59,000.
- Add a stop-loss at 66,000.
- Timeline: 1-2 days.
Bullish view
- Set a buy-stop at 64,000 and a take-profit at 66,000.
- Add a stop-loss at 60,000.
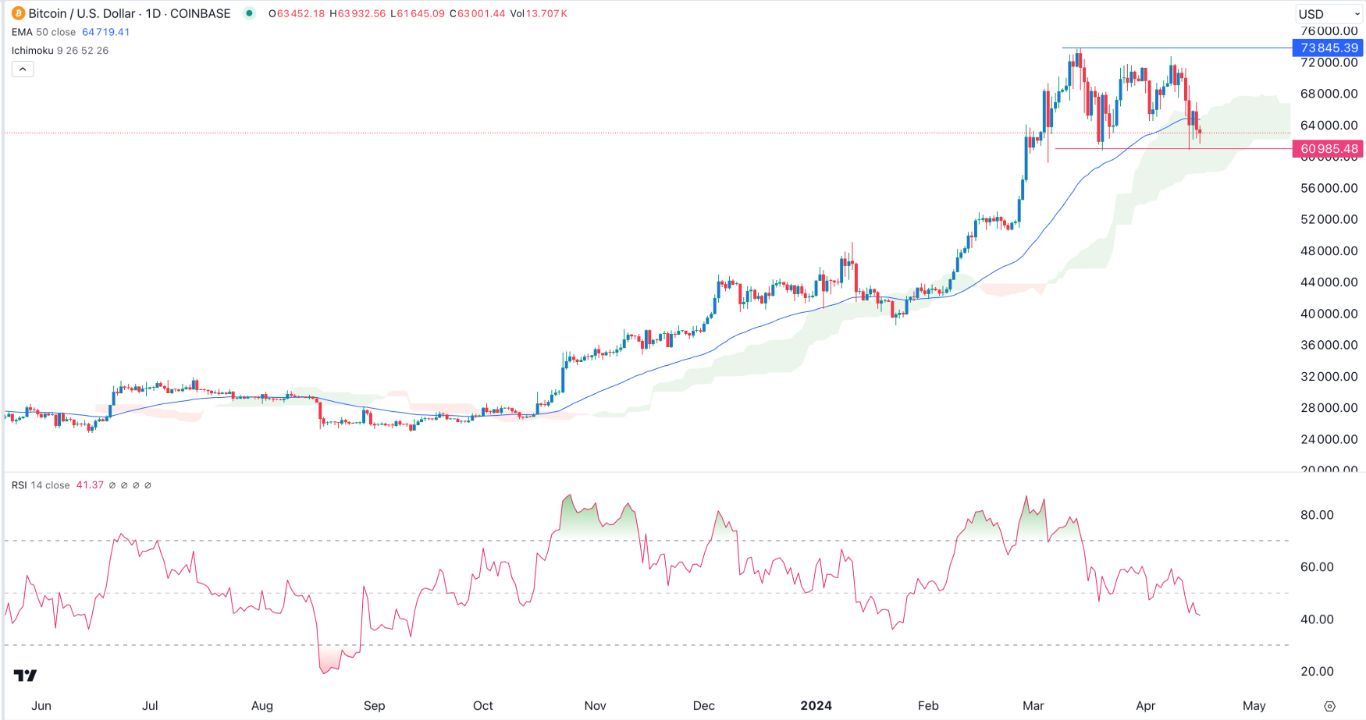
Bitcoin price continued its sell-off on Wednesday as bears attempted to push it to the crucial support level at $60,000. The BTC/USD pair plunged to a low of 62,800, a price that is significantly lower than the year-to-date high of 73,400.
Bitcoin halving is nearing
This will be an important week for Bitcoin as it goes through the crucial event known as halving. Halving, which happens every four years, helps to reduce the supply of Bitcoin in the market by cutting mining rewards by half.
The first halving happened in November 2012 followed by the other one in June 2016 and May 2020. A look at the data shows that the coin has always been higher than the previous halving when it happened.
In the first one, Bitcoin was trading at $12 followed by $640 in 2016 and $8,605 in 2020. Therefore, there is a high possibility that the coin will be much higher than where it is today.
Bitcoin price has pulled back ahead of halving since the event has already been priced in by market participants. This explains why the coin has jumped sharply in the past few months. As such, the retreat is happening as traders sell the news.
Still, Bitcoin has strong fundamentals. Its supply growth is expected to continue falling when the halving event happens. Also, this is happening at a time when supply in exchanges has slumped to a multi-month low.
There is also institutional demand for Bitcoin ETFs. Just this week, regulators in Hong Kong allowed the launch of several ETFs, which is important because it will give Chinese investors a chance to invest in Bitcoin. China banned Bitcoin and other cryptocurrencies in 2021.
The BTC/USD pair is also retreating because of the strong US dollar as hopes of a rate cut faded. The dollar has soared to its highest point since October last year.
Top Forex Brokers
BTC/USD Technical Analysis
The daily chart shows that the BTC/USD pair formed a triple top pattern, signaling that buyers are afraid of moving above 72,000. In price action analysis, a triple-top is a popular bearish sign. This sign is usually confirmed when the pair drops below the neckline at 60,985.
The pair has retreated below the 50-day moving average. It has also moved inside the Ichimoku cloud indicator. The Relative Strength Index (RSI) has crashed below the neutral point at 50. Therefore, the outlook for the pair is bearish, with the next level to watch being at 59,000.
On the positive side, we can assume that the rectangle channel that has formed is part of a bullish flag pattern.
Ready to trade our daily Forex signals? Here’s a list of some of the best crypto brokers to check out.


