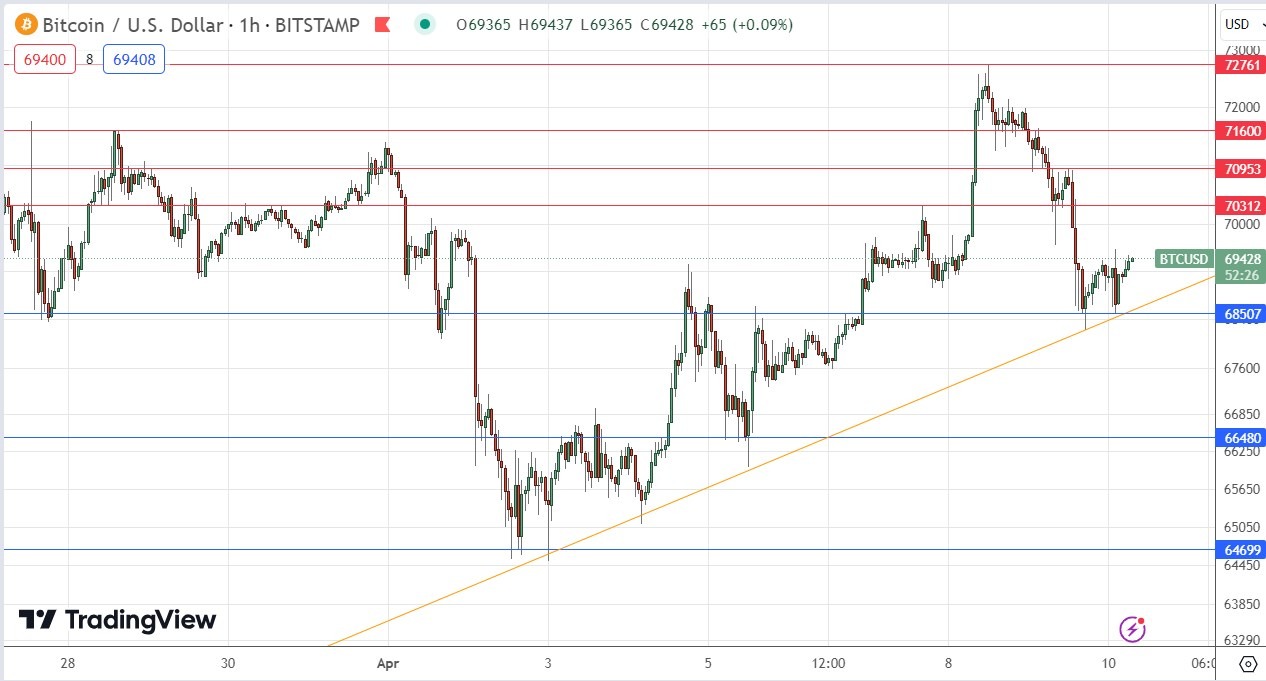
My previous BTC/USD signal on 3rd April was not triggered as there was no bearish price action when the resistance level at $66,480 was first reached.
Today’s BTC/USD Signals
- Risk 0.75% per trade.
- Trades must be entered before 5pm Tokyo time Thursday.
Long Trade Ideas
- Go long after a bullish price action reversal on the H1 timeframe following the next touch of $68,507, $66,480, or $64,699.
- Put the stop loss $100 below the local swing low.
- Move the stop loss to break even once the trade is $100 in profit by price.
- Take off 50% of the position as profit when the trade is $100 in profit by price and leave the remainder of the position to run.
Short Trade Ideas
- Go short after a bearish price action reversal on the H1 timeframe following the next touch of $70,480 or $70,953, or $71,600.
- Put the stop loss $100 above the local swing high.
- Move the stop loss to break even once the trade is $100 in profit by price.
- Take off 50% of the position as profit when the trade is $100 in profit by price and leave the remainder of the position to run.
The best method to identify a classic “price action reversal” is for an hourly candle to close, such as a pin bar, a doji, an outside or even just an engulfing candle with a higher close. You can exploit these levels or zones by watching the price action that occurs at the given levels.
Top Forex Brokers
BTC/USD Analysis
I wrote in my previous BTC/USD analysis one week ago that the technical picture had become a bit more bearish with price action stuck within a narrow range. I thought that a productive approach could be to wait for a breakout – bullish above $66,480, and bearish below $64,699.
This was not a bad call although it was not relevant on the day, but this approach could have produced a profitable long trade the next day.
The technical picture has changed again. We see the price continuing to consolidate below recent all-time highs near $74,000, with the $72,500 area being where we begin to get heavy selling.
We have several new resistance levels below that close by overhead, which will likely weigh on the price later.
However, this is counteracted below with the ascending trend line shown within the price chart above, as well as horizontal price levels.
I see the best opportunity which might set up today as a bearish breakdown below the ascending trend line and the horizontal support level at $68,507. The trigger here could be to go short once there are two consecutive lower hourly closes below $68,500 targeting the next support level at $66,480. Of course, it will be important to make sure there is a good reward to risk ratio.
Regarding the US Dollar, there will be a release of CPI data at 1:30pm London time, followed by FOMC Meeting Minutes at 7pm.
Ready to trade our daily Bitcoin signals? Here’s our list of the best crypto brokers worth reviewing.


