Bullish view
- Buy the BTC/USD pair and set a take-profit at 73,940.
- Add a stop-loss at 68,000.
- Timeline: 1-2 days.
Bearish view
- Sell the BTC/USD pair and set a take-profit at 68,000.
- Add a stop-loss at 72,000.
Bitcoin price retreated sharply in the overnight session as investors embraced a risk-off sentiment after the strong US inflation report. The BTC/USD pair plunged to a low of 67,473, its lowest point since April 6th.
Risk-off sentiment
A risk-off sentiment spread in the financial market after the US released strong inflation numbers on Wednesday. Inflation rose from 3.2% in February to 3.5% in March. Core inflation also jumped by 3.8%, almost double the Fed target of 2.0%.
These numbers mean that the Federal Reserve will likely shift its tone on interest rates. Minutes released on Wednesday revealed that most officials wanted more confidence that inflation is moving toward the 2% target.
Therefore, since inflation is not falling, there is a likelihood that the Federal Reserve will maintain interest rates intact for longer. Some analysts expect that the bank will even hike interest rates.
Top Forex Brokers
The BTC/USD pair dipped, joining other risk assets in a strong sell-off. US bonds sold off, with the 10-year yield jumping to 4.55% while the 30-year and 5-year yields soared to 4.58% and 4.53%, respectively.
US equities also plunged, with the Dow Jones and the Nasdaq 100 indices shedding 485 and 160 points, The US dollar index, on the other hand, rose by over 1% to almost $105.
Bitcoin is also dipping as spot Bitcoin ETFs inflows slow. Recent data shows that the Grayscale Bitcoin Trust has shed assets worth billions of dollars. The other Bitcoin ETFs by companies like Blackrock, Invesco, and Franklin Templeton have seen a slow increase in inflows.
BTC/USD technical analysis
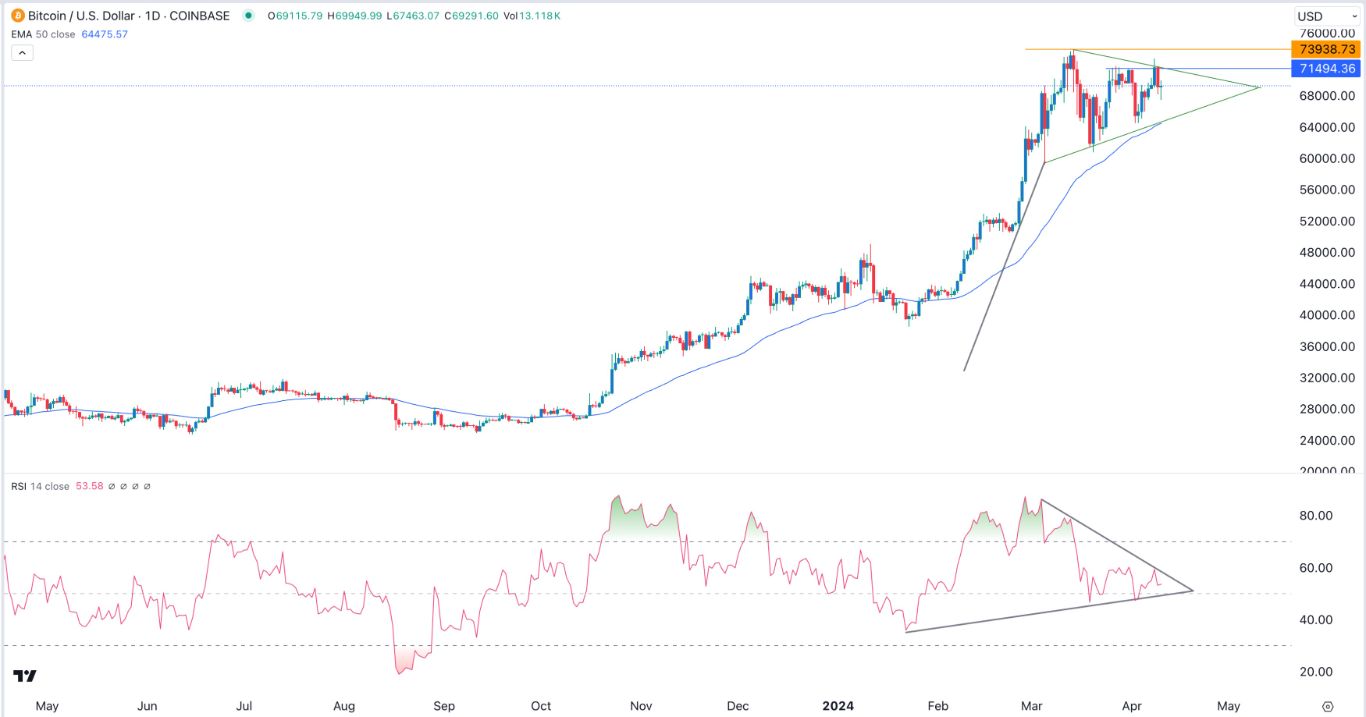
The daily chart shows that the price of Bitcoin has been in a narrow range in the past few weeks. It has retreated from the year-to-date high of 73,940 to a low of 69,405. The pair has formed a bullish pennant pattern, which is characterized by a small triangle pattern and a flag pole.
Bitcoin has constantly remained above the 50-day Exponential Moving Average (EMA), which is a positive sign. Also, the Relative Strength Index (RSI) has formed a triangle pattern. It has moved to the neutral point.
Therefore, the outlook for Bitcoin is bullish, with the next point to watch being the year-to-date high of 73,940. A break above that price will point to more gains, with the next target to watch being at 75,000.
Ready to trade our free daily Forex trading signals? We’ve shortlisted the best MT4 crypto brokers in the industry for you.


