Bullish view
- Buy the BTC/USD pair and set a take-profit at 71,500.
- Add a stop-loss at 68,000.
- Timeline: 1-2 days.
Bearish view
- Set a sell-stop at 69,000 and a take-profit at 68,000.
- Add a stop-loss at 71,000.
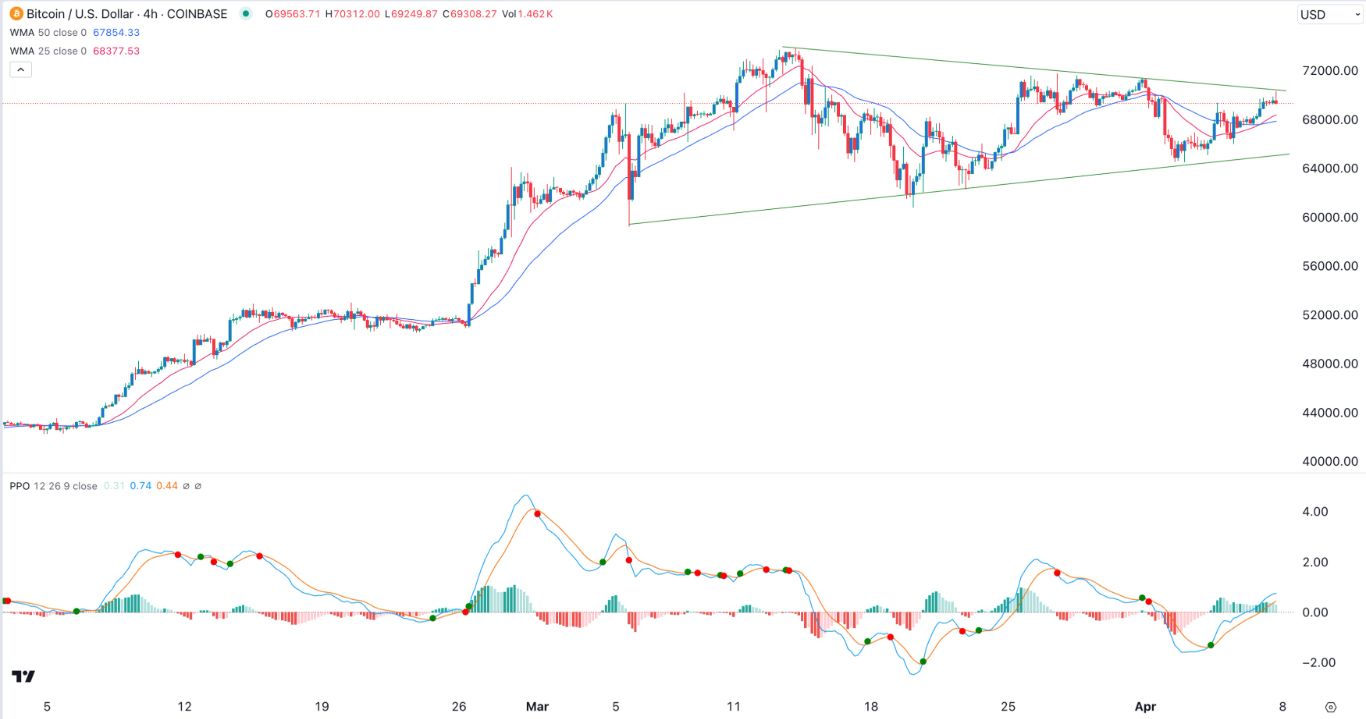
Bitcoin price held steady during the weekend as bulls attempted to push it above the crucial resistance point at $70,000. The BTC/USD pair has bounced back as the countdown to the halving event continues. Still, buyers have struggled to push it above the year-to-date high of over 73,500.
Bitcoin ETF inflows and Silk Road
The price of Bitcoin has remained on edge recently as investors focus on the trends in the ETF market. The biggest news was the trends in the Grayscale Bitcoin Trust (GBTC), which has been shedding substantial assets recently.
Data shows that the fund has shed assets worth over $15 billion this year. It lost $565 million last week after losing $1 billion a year earlier.
Some of these funds are moving to other low-cost spot Bitcoin ETFs like the iShares Bitcoin Trust (IBIT), Fidelity Wise Origin Bitcoin fund (FBTC), and the Ark 21Shares Bitcoin ETF (ARKB). People who invest in these funds make substantial savings since the GBTC fund has an expense ratio of 1.50%.
Top Forex Brokers
Some of these funds are also moving to other safe-haven assets like gold and silver. ETFs tracking these two metals have gained billions in assets as their prices jump. Gold has soared to a record high as concerns about the US debt rise.
Bitcoin has also struggled as concerns about the Federal Reserve remain. Investors are concerned that the Fed may not cut interest rates as expected. Initially, the view was that the Fed would deliver three cuts this year.
Now, with the US economy doing well, there are signs that the number of cuts will be fewer than expected. The US published strong jobs numbers on Friday while inflation has remained above the 2% Fed target.
The next important catalyst for Bitcoin will be the upcoming halving event, which will happen in the coming weeks.
BTC/USD technical analysis
The BTC/USD pair tilted upwards during the weekend. It jumped and retested the important descending trendline that connects the highest swings since March 14th. It is also the upper side of the symmetrical triangle pattern that has formed recently.
Bitcoin has also moved slightly higher than the 50-period and 25-period Weighted Moving Averages (WMA). The Percentage Price Oscillator (PPO) has moved above the neutral point, which is a positive sign.
Therefore, the pair will likely remain in this range in the next few days. In this case, the important support and resistance levels to watch will be at 67,500 and 71,000.
Ready to trade our daily Forex signals? Here’s a list of some of the best crypto brokers to check out.


