Fundamental Analysis & Market Sentiment
I wrote on 7th April that the best trade opportunities for the week were likely to be:
- Long of the NASDAQ 100 Index following a daily close above 18400. This did not set up.
- Long of Bitcoin, following a daily close above $74,000. This did not set up.
- Long of Gold. This gave a win of 0.60%.
- Long of Silver. This gave a win of 1.44%.
- Long of the USD/JPY currency pair following a daily close above ¥152. This set up on Wednesday and gave a win of 0.03%.
- Long of Cocoa Futures, but with only half a normal position size, following a daily close above 10,324. This did not set up until the week closed.
The overall result was a net win of 2.07%, resulting in a gain of 0.35% per asset.
Last week saw low directional volatility in the Forex market, which has been relatively low since 2024 started.
Last week’s key event was the release of US CPI data, which was expected to show a small drop in the month-on-month increase from 0.4% to 0.3%, but as it happened, the rate was unchanged, leading to a new higher annualized inflation rate of 3.5%. This led to a stronger US Dollar and a selloff in stocks, and although markets clawed back some of that later in the week, the increased likelihood of direct conflict between Iran and Israel saw stocks and commodities lose value.
Last night saw an Iranian attack on Israel which consisted of over 300 drones, cruise missiles, and ballistic missiles, which seemingly were fired against military targets within Israel. Israel and its allies seem to have managed to shoot down everything except 7 ballistic missiles which made impacts, with Israel claiming only light damage to a military facility. Sirens sounded in much of Israel for about 20 minutes during the night, including in the Israeli capitol Jerusalem. Israel has not yet retaliated to the Iranian strike, and President Biden has made it clear he will not support a retaliatory strike by Israel. Israel may decide to retaliate anyway, and its decision here is likely to influence what happens in the markets over coming days. If it seems likely that the matter between Iran and Israel is closed for now, stock markets will rise, and the US Dollar will probably fall. If there is Israeli retaliation it will probably have the opposite effect.
US PPI data released last week came in much better than the earlier CPI data, showing the producers were dealing with price increases of only 0.2% month-on-month, compared to the 0.3% which was expected.
The Federal Reserve released its most recent FOMC meeting minutes, which reiterated the same recent talking points – that the Fed is in no hurry to cut rates and is waiting to see more evidence that inflation is falling to their 2% before taking further policy action.
Last week also saw the European Central Bank, the Bank of Canada, and the Reserve Bank of New Zealand all leave their respective interest rates unchanged.
There were only a few other important economic data releases last week:
- US 30-Year Bond Auction – yields were firmly higher.
- UK GDP – the small month-on-month increase was expected.
- US Prelim UoM Consumer Sentiment – slightly worse than expected.
- US Unemployment Claims – approximately as expected.
Top Forex Brokers
The Week Ahead: 15th – 19th April
The most important items over the coming week will be the release of US CPI (inflation) data, and central bank policy releases from the European Central Bank, the Bank of Canada, and the Reserve Bank of New Zealand. Apart from these, there are a few other important releases due:
- US Retail Sales
- UK CPI
- Canadian CPI
- New Zealand CPI
- US Empire State Manufacturing Index
- US Unemployment Claims
- Chinese Industrial Production
- UK Retail Sales
- UK Claimant Count Change
- Australian Unemployment Rate
Monthly Forecast April 2024

At the start of April, the long-term trend in the US Dollar was unclear, so I again did not make any monthly Forex forecast.
Weekly Forecast 14th April 2024
Last week, I made no weekly forecast, as there were no strong counter-trend price movements in any currency crosses, which is the basis of my weekly trading strategy.
I again give no forecast this week.
Directional volatility in the Forex market was higher last week, with 26% of the most important currency pairs fluctuating by more than 1%.
Last week, relative strength was observed in the US Dollar, and relative weakness was observed in the Canadian Dollar.
You can trade these forecasts in a real or demo Forex brokerage account.
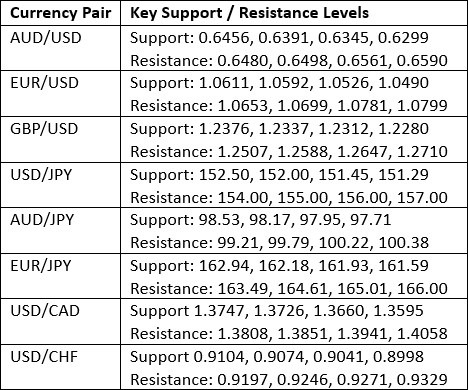
Key Support/Resistance Levels for Popular Pairs
Technical Analysis
US Dollar Index
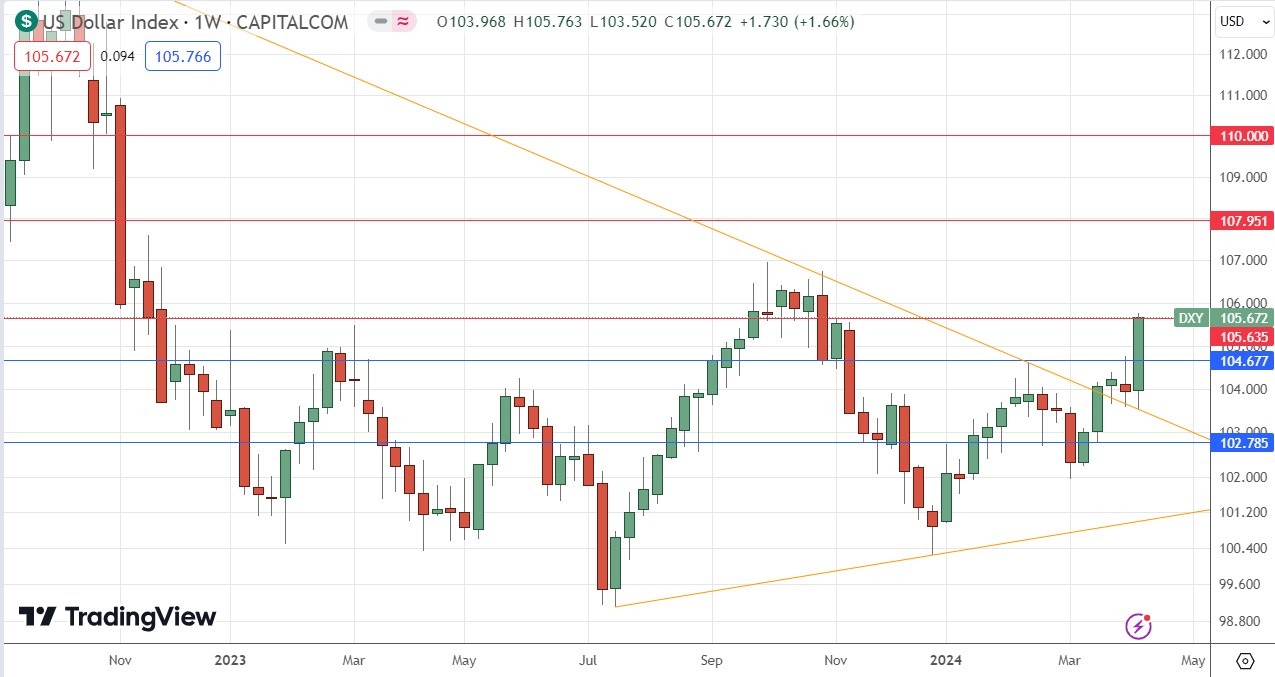
The US Dollar Index printed a large bullish candlestick last week, which closed very near the top of its range, at a new 5-month high price. These are bullish signs.
However, the weekly close presented a mixed long-term trend, as it was higher than three months ago but lower than six months ago, although the price is not far from breaking into a long-term bullish trend.
Zooming out to look at the long-term price action shows that the US Dollar Index has decisively broken above the narrowing triangle pattern, as well as the former resistance level at 104.68, and what may now be broken resistance at 105.64.
Bulls should be aware the Dollar is not fully in bullish territory, but last week’s higher-than-expected US CPI data has reduced the chance of a rate hike over the near term, which has boosted the value of the greenback.
The Dollar may pull back over the coming week, but it probably will make most sense now to take trades long of the Dollar, and not short.
NASDAQ 100 Index
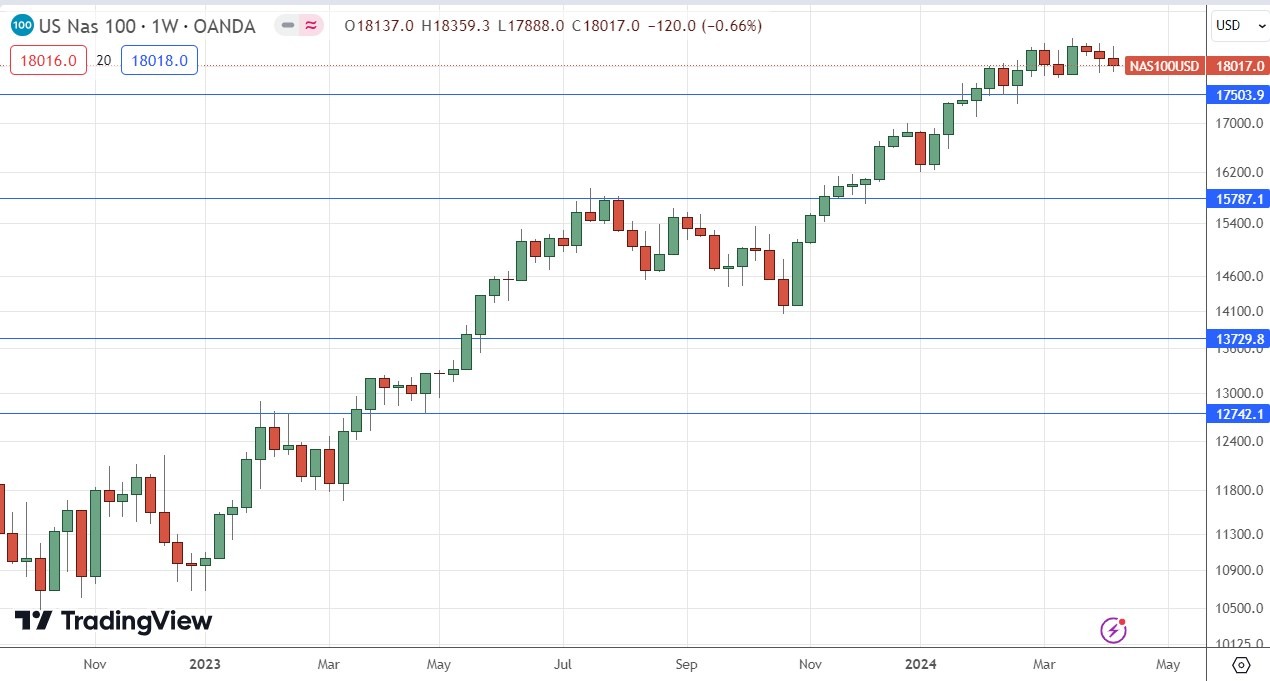
The NASDAQ 100 Index printed another bearish candlestick last week, which was both a pin bar and an inside bar. This suggests that the price is at least a little more likely than not to continue falling as the new week gets underway, although that might depend on whether Israel retaliates against Iran’s weekend strike against it.
Stubbornly high US CPI data has given stocks a bit of a knock, although there is some buoyancy in the stock market caused by better-than-expected earnings reported lately by many companies.
Technically, the price has been consolidating for about six weeks now between 18000 and 18400 – it is very notable how there is selling every time the price gets to 18400, suggesting that this has become a natural area of resistance.
There are long-term reasons to be bullish on US stocks, partly because when major US stock indices break to new all-time highs as they have recently, it is typically followed by a year of strong gain which are well above average. Despite that, there is no reason why we are not due a deeper bearish retracement here.
However, I would not enter a new long trade here until we see a new daily close at a record high above 18400.
Gold
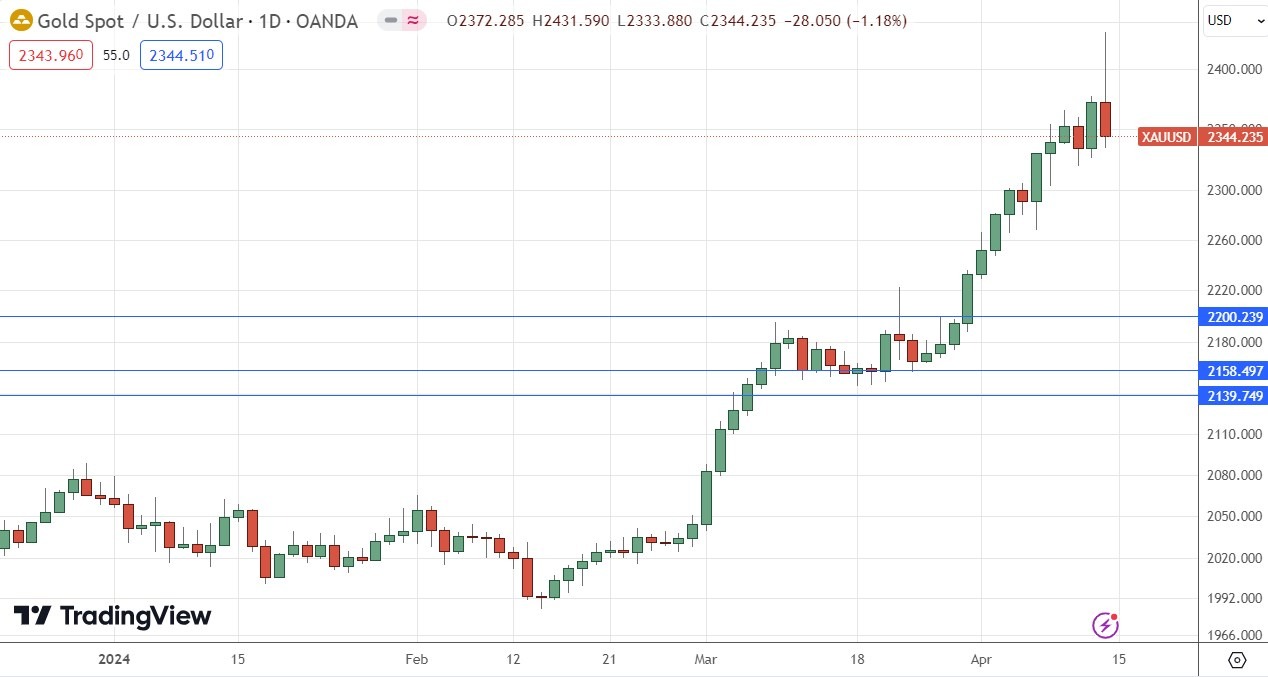
Gold rose strongly last week, rising even beyond the next round number at $2400, but then gave up most of its weekly gains on Friday, ending with a weekly candlestick that is almost a bearish pin bar.
The daily price chart below shows that last week ended with Friday’s daily candlestick looking very bearish – it was almost a pin bar – and the price ended much lower after reaching above $2400 earlier that day.
It is important to remember that Gold has historically been positively correlated with the stock market and other risky assets, and it is far from being a hedge against them as is commonly supposed. Some analysts will see Gold as likely to rise due to tensions in the Middle East, and this might happen if Israel retaliates against this weekend’s Iranian strike.
I see Gold as a buy, but not until we see much more bullish price action, producing a daily close above $2373.
Silver
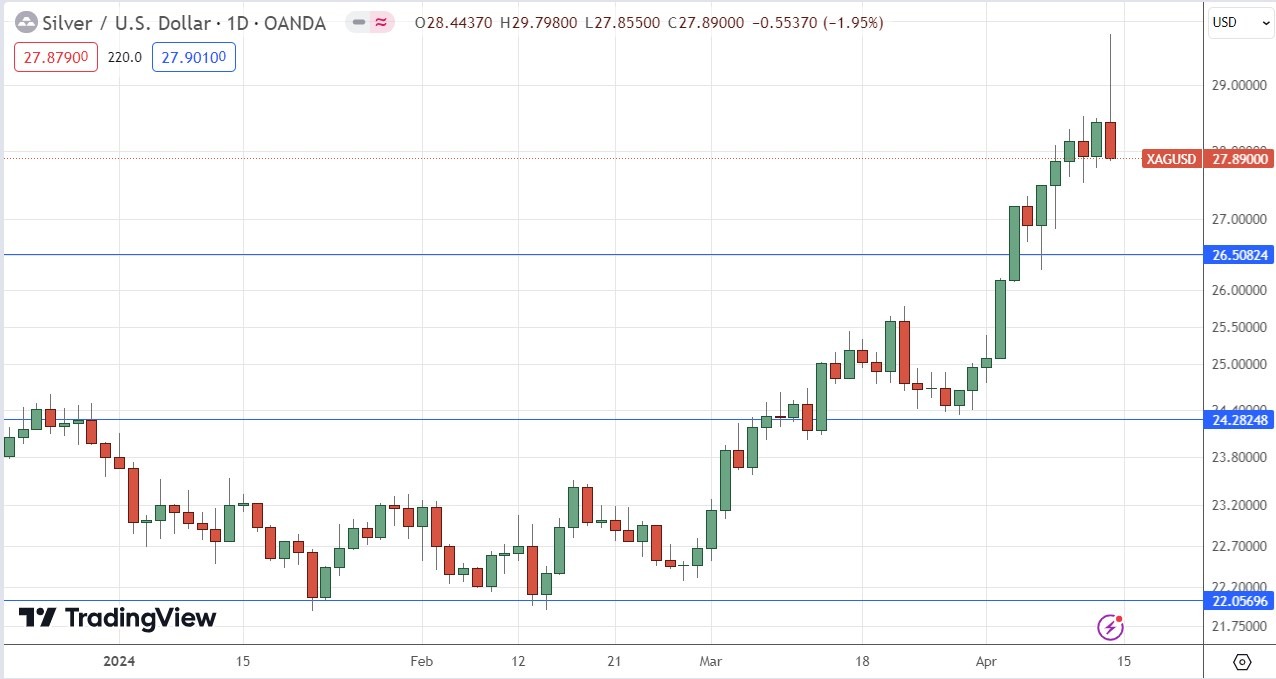
Silver rose strongly last week, rising even beyond the next round number at $29, but then gave up most of its weekly gains on Friday, ending with a weekly candlestick that is almost a bearish pin bar.
The daily price chart below shows that last week ended with Friday’s daily candlestick looking very bearish – and the price ended much lower after trading above $29 earlier that day.
It is important to remember that Silver has historically been positively correlated with the stock market and other risky assets, and it is far from being a hedge against them as is commonly supposed.
I see Silver as a buy, but not until we see much more bullish price action, producing a daily close above $28.45.
GBP/USD
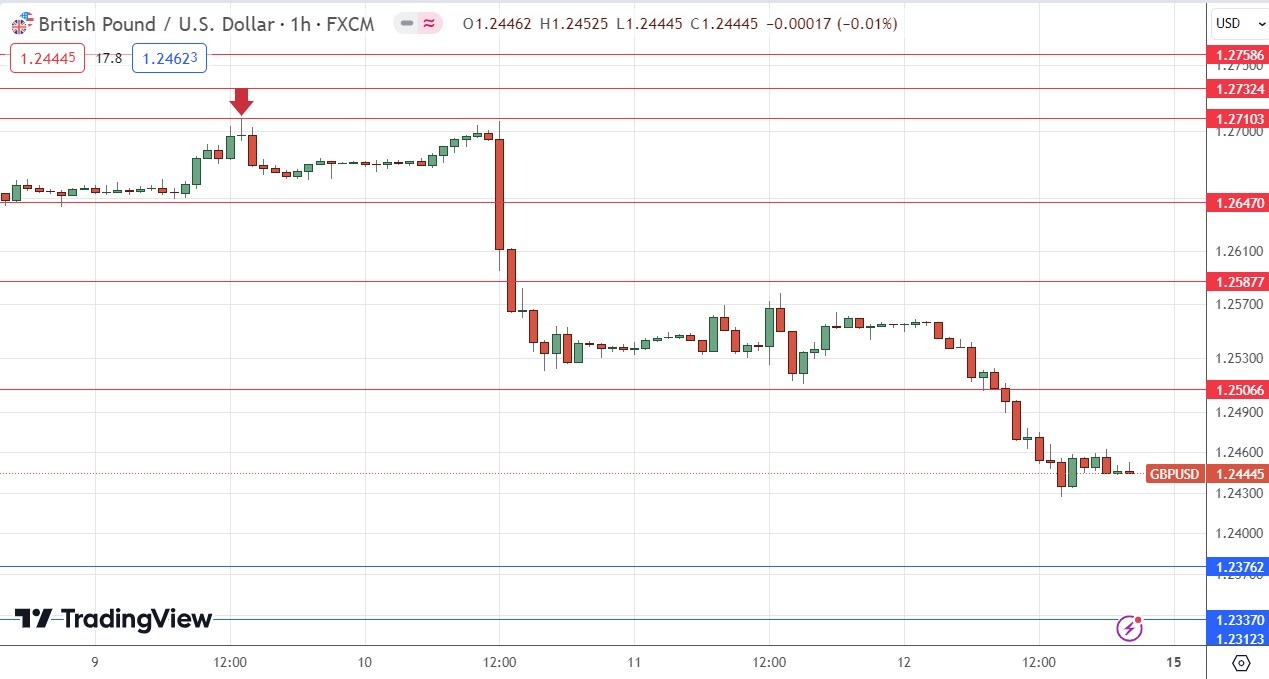
I expected that the GBP/USD currency pair would have potential resistance at $1.2710.
The H1 price chart below shows how this resistance level was rejected right at the start of last Tuesday’s London / New York session overlap by a gravestone doji, marked by the down arrow in the price chart below, signaling the timing of this bearish rejection. This can be an excellent time of day to enter a trade in a major currency pair.
This trade was very profitable, with a maximum reward-to-risk ratio of approximately 13 to 1 based on the size of the entry candlestick.
USD/CAD
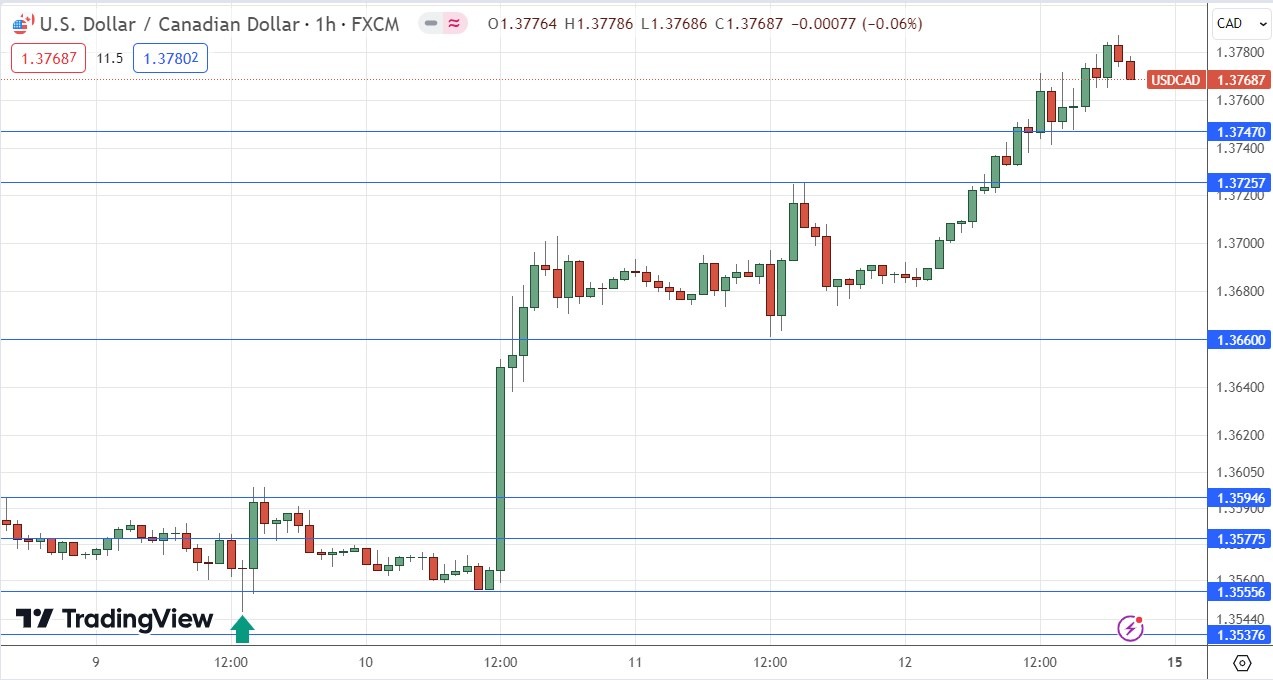
I expected that the USD/CAD currency pair would have potential support at $1.3556.
The H1 price chart below shows how this resistance level was rejected right at the start of last Tuesday’s London / New York session overlap by a gravestone doji, marked by the up arrow in the price chart below, signaling the timing of this bullish rejection. This can be an excellent time of day to enter a trade in a currency pair which involves the US Dollar such as this one.
This trade was extremely profitable, with a maximum reward-to-risk ratio greater than 18 to 1 based on the size of the entry candlestick.
USD/JPY
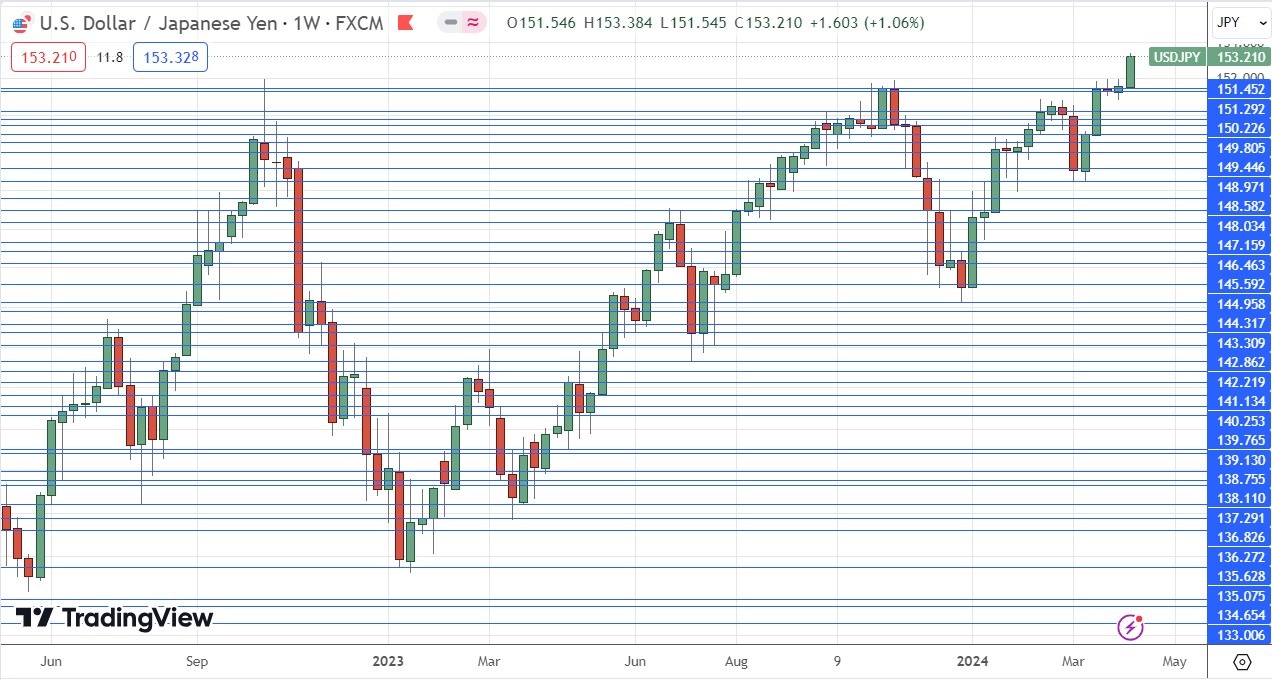
The USD/JPY currency pair finally managed to make a bullish breakout beyond the key resistance level at ¥152, which has also been seen as a price that the Bank of Japan would defend. However, professional traders were unconvinced that the Bank could successfully defend this level, and they were proven right. The price consolidated below this big round number and 34-year record high price before finally breaking beyond it when the higher-than-expected US CPI data was released, as this makes rate cuts by the Fed less likely to happen any time soon.
The reaction of the Bank of Japan and the Japanese financial establishment was muted, so I think we could see a further rise in price over the coming week.
I see the USD/JPY currency pair as a buy.
Gasoline Futures
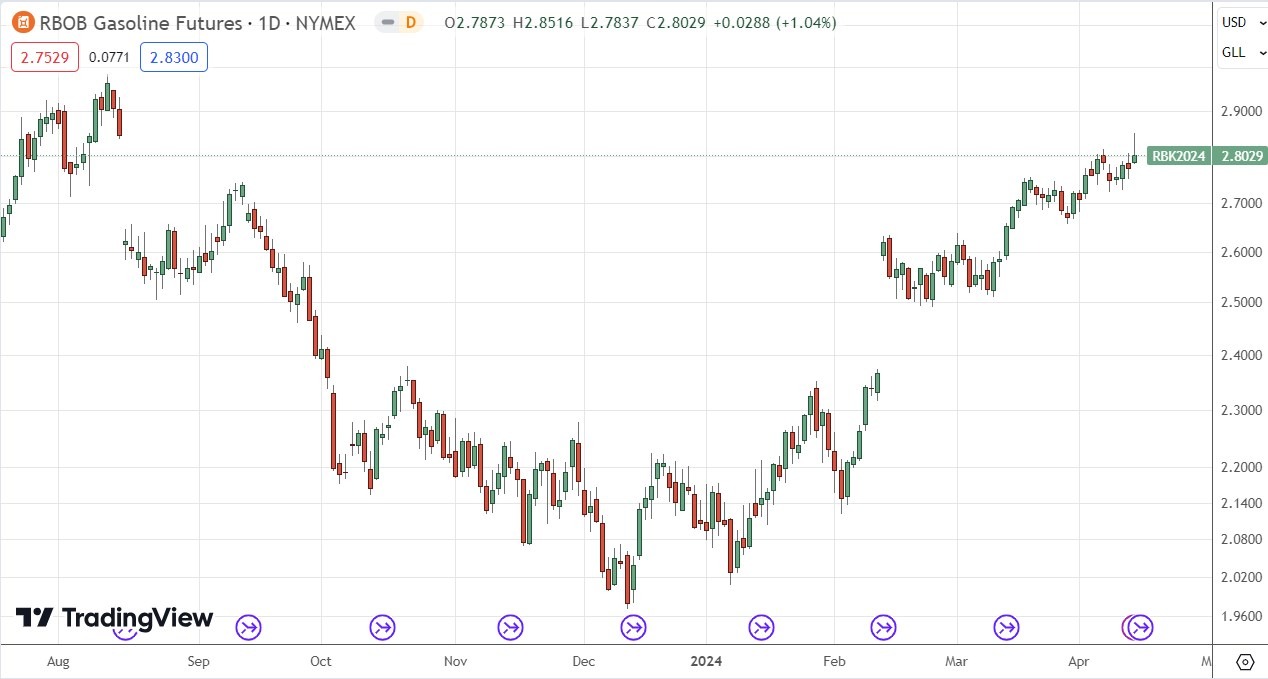
Gasoline Futures moved weakly higher over the week, to touch a new 8-month high. This is a sign of a valid long-term bullish trend. Gasoline is moving higher in line with Crude Oil, and in fact is a little more bullish.
Despite this bullish picture, it is important to note that the bullish momentum is not very strong.
Some analysts have seen the recent spike in tensions in the Middle East, culminating in yesterday’s attack on Israel by Iran, as driving the price of Crude Oil and Gasoline higher. As Israel weighs retaliation, it may be that this pushes energies higher at Monday’s open. If Israel does retaliate before then, we can definitely expect a higher open.
I see Gasoline Futures as a buy, but only following a daily close above 2.8516.
Cocoa Futures
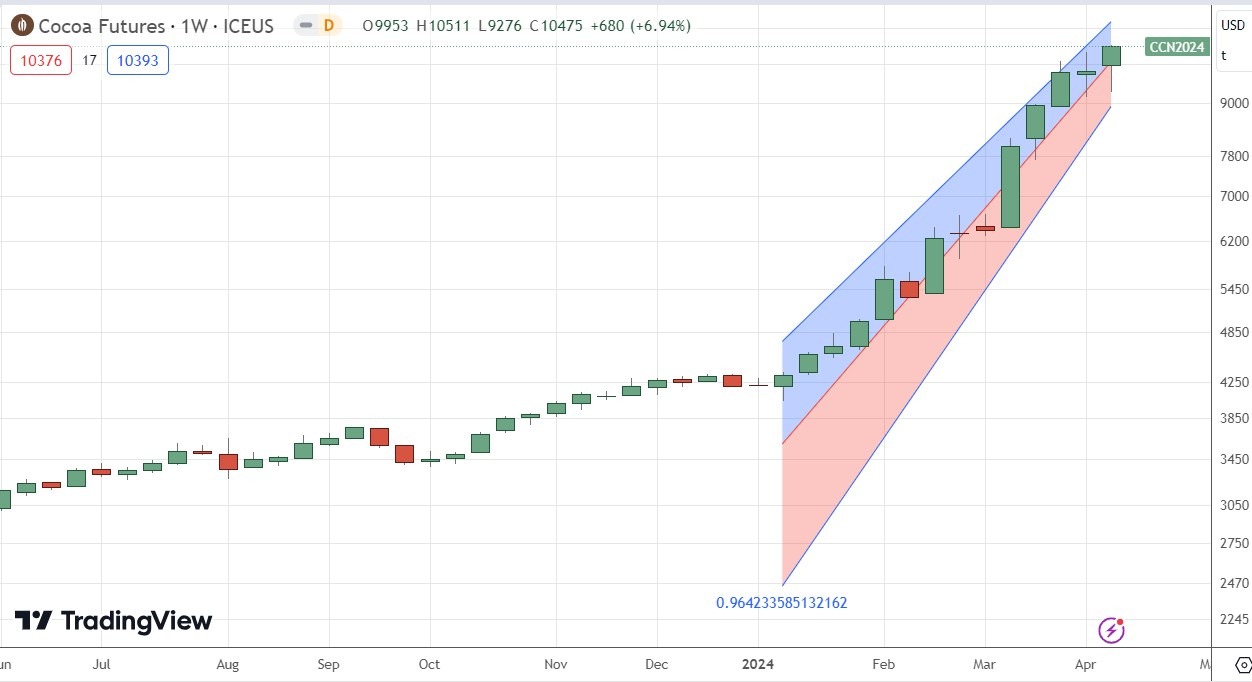
Cocoa Futures made yet another bullish move last week and rose to reach a new multiyear high. The price ended the week very close to the high of its weekly price range. These are very bullish signs.
You can apply a linear regression analysis to the start of the increased bullish momentum 15 weeks ago. Since then, the price of Cocoa futures has more than doubled! Cocoa is now more expensive pound for pound than Copper.
Cocoa has made yet another new bullish breakout, so getting back in with a long trade, maybe hoping for another bite of the cherry. Is still a valid move. This amazing trend will eventually end, but there is no point in calling a top. However, using a trailing stop in this kind of trade is extremely important.
I see Cocoa as a buy.
Bottom Line
I see the best trading opportunities this week as follows:
- Long of the NASDAQ 100 Index following a daily close above 18400.
- Long of Gold following a daily close above $2373.
- Long of Silver following a daily close above $28.45.
- Long of the USD/JPY currency pair.
- Long of Gasoline Futures following a daily close above 2.8516.
- Long of Cocoa Futures, but with only half a normal position size.
Ready to trade my weekly Forex forecast? Here are the best Forex brokers to choose from.
