Fundamental Analysis & Market Sentiment
I wrote on 31st March that the best trade opportunities for the week were likely to be:
- Long of the S&P 500 Index. This gave a loss of 1.02%.
- Long of Bitcoin, following a daily close above $74,000. This did not set up.
- Long of Gold. This gave a win of 4.35%.
- Long of the USD/JPY currency pair following a daily close above ¥152. This did not set up.
- Long of Cocoa Futures, but with only half a normal position size. This gave a win of 0.39%.
The overall result was a net win of 3.72%, resulting in a gain of 0.74% per asset.
Last week saw low directional volatility in the Forex market, which has been relatively low since 2024 started.
Last week’s key event was the much higher than expected US non-farm payrolls data released last Friday, which saw over 300,000 net new jobs created, and a surprise fall in US unemployment from 3,9% to 3.8%. This has probably made the Fed less likely to cut rates three times over 2024 as expected, or at least pushed back the schedule for this, which will likely weigh on stocks. The major US indices all fell following the news, although they regained much of the loss late on Friday.
Last week also saw German Preliminary CPI come in slightly lower than expected, at a month-on-month increase of 0.4%, while an increase of 0.5% was expected, suggesting that German inflation may be cooling, as it fell to a 3-year low.
The past week also saw some mixed signals from Fed members, with Fed Chair Powell putting out his familiar line. However, three other FOMC members have made more hawkish statements about rate cuts, with one even suggesting that rates may need to be hiked before being cut!
The outlook for US rates will likely depend now on any further comments from Fed members which may happen, but probably most of all the US CPI (inflation) data which will be released this Wednesday.
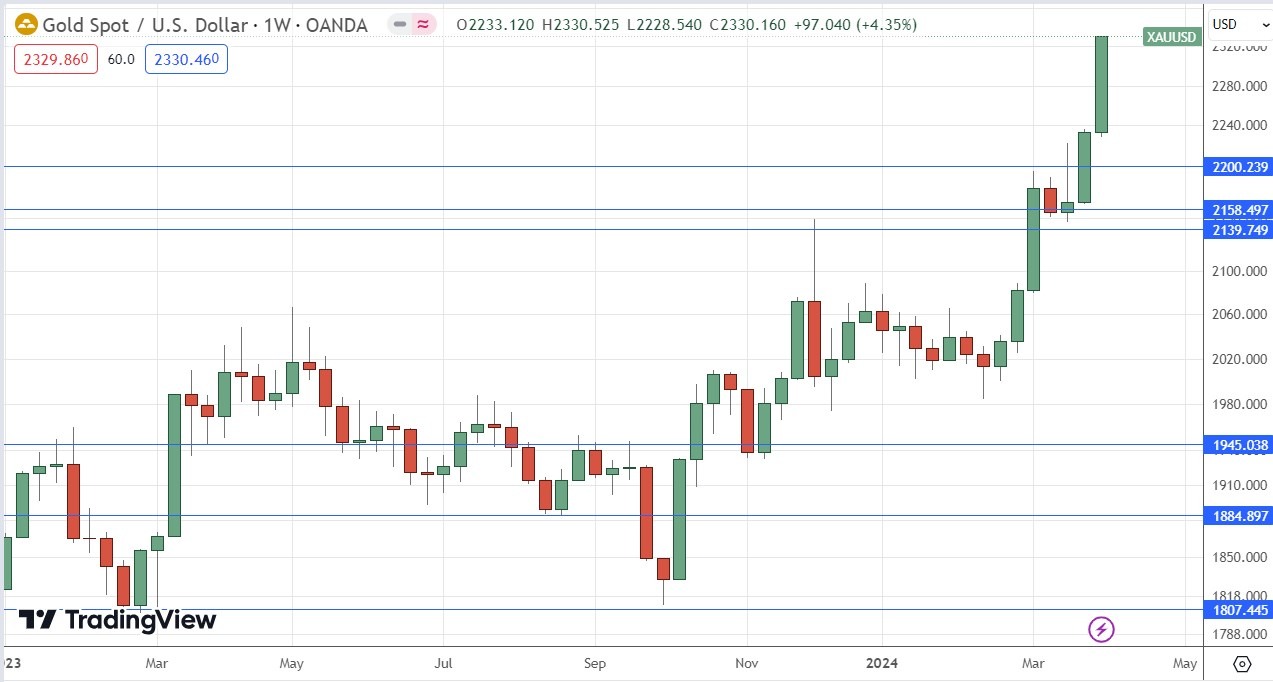
Gold was a standout asset last week as it rose strongly to close right on its fresh all-time high it made on Friday at $330.
There was interesting action in other commodities markets, with Cocoa futures trading at a new record above $11,000. WTI Crude Oil is rising to hit new 5-month highs.
There were only a few other important economic data releases last week:
- US JOLTS Job Openings – came in as expected.
- Swiss CPI (inflation) – considerably lower than expected, showing no change while a month-on-month increase of 0.3% was expected.
- US ISM Services PMI – a little worse than expected.
- US ISM Manufacturing PMI – slightly better than expected.
- US Unemployment Claims – approximately as expected.
- Canadian Unemployment Rate – saw a stronger increase than expected, from 5.8% to 6.1%.
Top Forex Brokers
The Week Ahead: 8th – 12th April
The most important items over the coming week will be the release of US CPI (inflation) data, and central bank policy releases from the European Central Bank, the Bank of Canada, and the Reserve Bank of New Zealand. Apart from these, there are a few other important releases due:
- US FOMC Meeting Minutes
- US PPI
- US 30-Year Bond Auction
- UK GDP
- US Prelim UoM Consumer Sentiment
- US Unemployment Claims
Monthly Forecast April 2024

For April, the long-term trend in the US Dollar was unclear, so I again did not make any monthly Forex forecast.
Weekly Forecast 7th April 2024
Last week, I made no weekly forecast, as there were no strong counter-trend price movements in any currency crosses, which is the basis of my weekly trading strategy.
I again give no forecast this week.
Directional volatility in the Forex market was unchanged last week, with only one of the most important currency pairs fluctuating by more than 1%.
Last week, relative strength was observed in the Australian Dollar, and relative weakness was observed in the Canadian Dollar.
You can trade these forecasts in a real or demo Forex brokerage account.
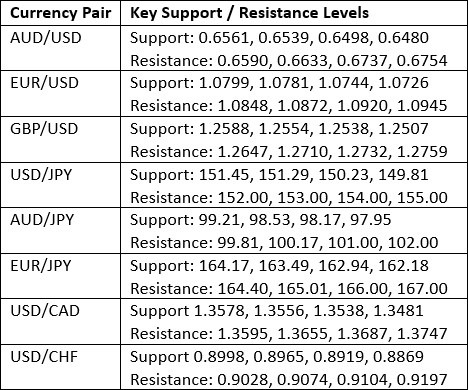
Key Support/Resistance Levels for Popular Pairs
Technical Analysis
US Dollar Index
The US Dollar Index printed a bearish pin bar last week, with the key resistance level at 104.68 holding the upper boundary of the week's price action. These are bearish signs.
The weekly close presented a mixed long-term trend, as it was higher than three months ago but lower than six months ago.
Zooming out to look at the long-term price action shows that the US Dollar Index has broken above the narrowing triangle pattern, which is a bullish sign, but does not look decisive.
The problem for bulls is that the resistance at 104.68 looks strong and may continue to hold down the price.
It makes sense to ignore the US Dollar over the coming week. It has no clear trend. Until we see more direction, it will likely be wise to trade non-USD assets and avoid Forex as an asset class.
If the coming week ends with a bullish close above 104.68, that could signify the start of a major bullish price movement, but this is unlikely to happen.

NASDAQ 100 Index
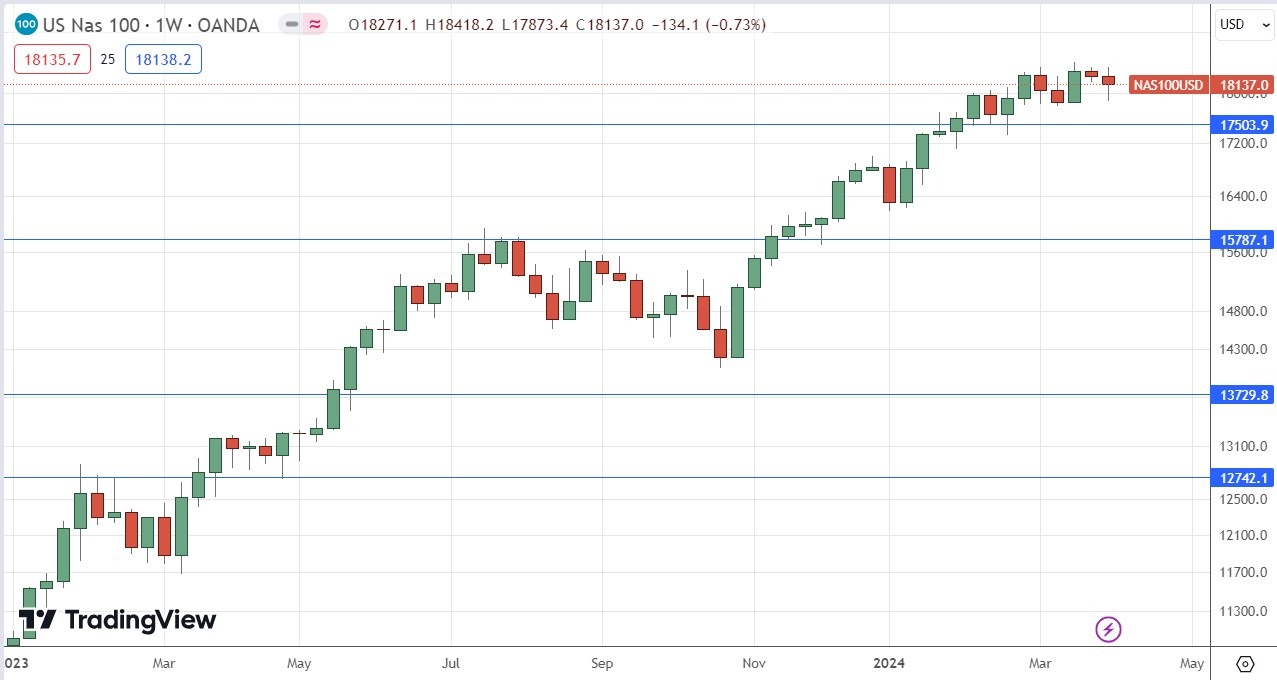
The NASDAQ 100 Index printed a potentially bearish outside doji candlestick last week. The price briefly traded above 18400 as late as Friday before falling quite strongly after US non-farm payrolls data came in much stronger than expected which in turn weakens expectations of Fed rate cuts, boosting the Dollar and knocking stocks.
Two things are interesting:
- The price keeps getting sold off every time it gets above 18400, suggesting this is a natural area of resistance.
- The price regained a lot of its losses later in Friday’s session, suggesting underlying bullishness.
There are long-term reasons to be bullish on US stocks, partly because when major US stock indices break to new all-time highs as they have recently, it is typically followed by a year of strong gain which are well above average.
I would not enter a new long trade here until we see a new daily close at a record high above 18400.
Bitcoin
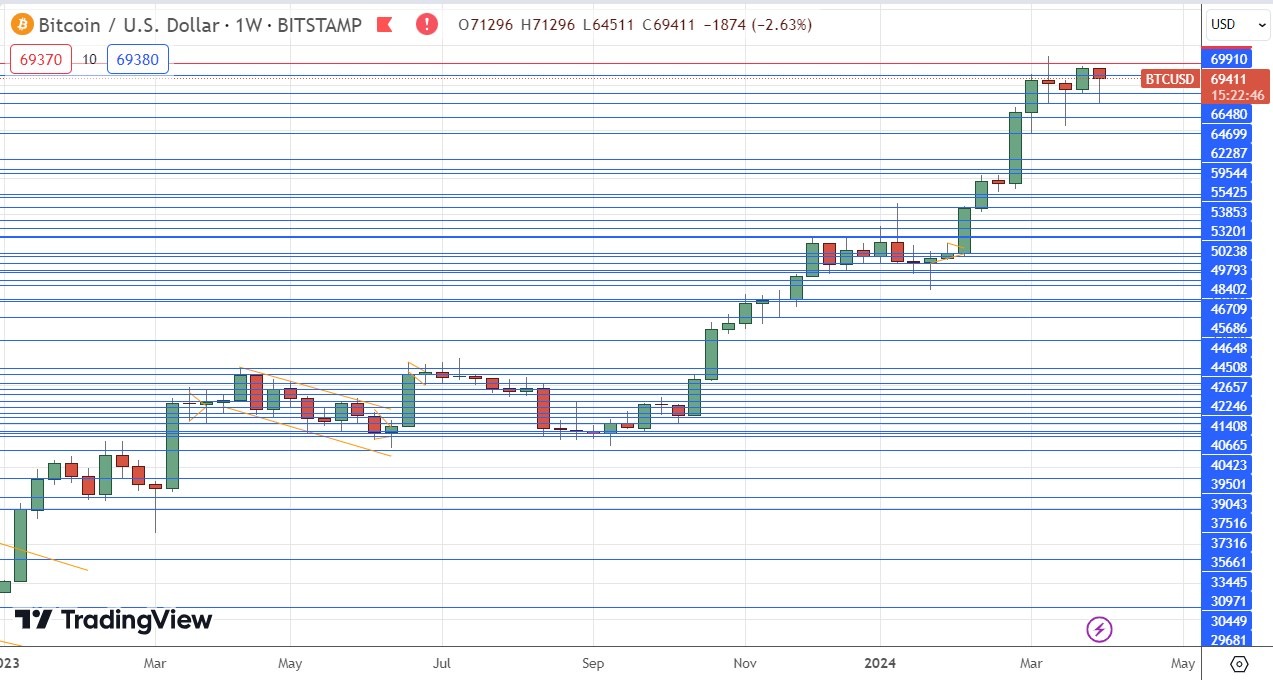
After last week’s record high close, which suggested that bulls would soon make another attempt at breaking the record high near $74,000, Bitcoin fell back but clawed back most of its gains, despite closing down a little over the week.
Bitcoin will look like a good buy if we get a daily close at new highs above $74,000. It is dangerous to do so in the meantime, as a look at the daily chart shows a recent consolidation below $74,000 which looks much more bearish than the weekly chart does.
If we do see a daily New York close above $74,000 I recommend using a trailing stop for anyone going long here. In this kind of trade, it is important due to the high volatility and unpredictability inherent to even major cryptocurrencies such as Bitcoin.
Gold
Gold rose very strongly last week, printing a large bullish candlestick which closed right at the top of its weekly price range. The close was at an all-time high price against every major currency, even the strong USD. The strong rise is a near-exact mirror of what happened during the previous week, too.
Gold is remarkably strong now, having risen convincingly during the strong risk-on rally of recent weeks if it can be called that for simplicity's sake. It is important to remember that Gold has historically been positively correlated with the stock market and other risky assets, and it is far from being a hedge against them as is commonly supposed.
I see Gold as a buy right now.
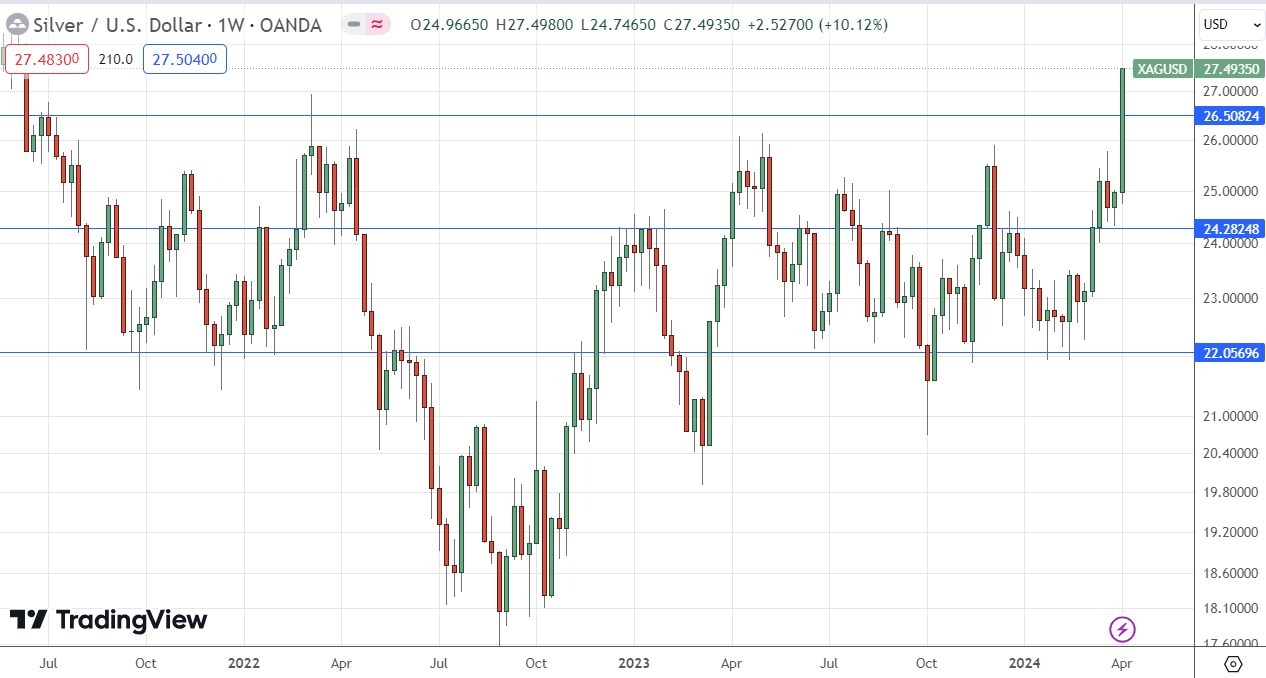
Silver
Silver rose very strongly last week, printing a very large bullish candlestick which closed right at the top of its weekly price range. The close was at 2.5-year high price against every major currency.
Precious metals are remarkably strong now, having risen convincingly during the strong risk-on rally of recent weeks if it can be called that for simplicity's sake. It is important to remember that Silver has historically been positively correlated with the stock market and other risky assets, and it is far from being a hedge against them as is commonly supposed.
I see Silver as a buy right now, but keep in mind that if you are already long of Gold, that these two previous metals tend to be strongly positively correlated, so try to limit your overall risk accordingly.
EUR/USD
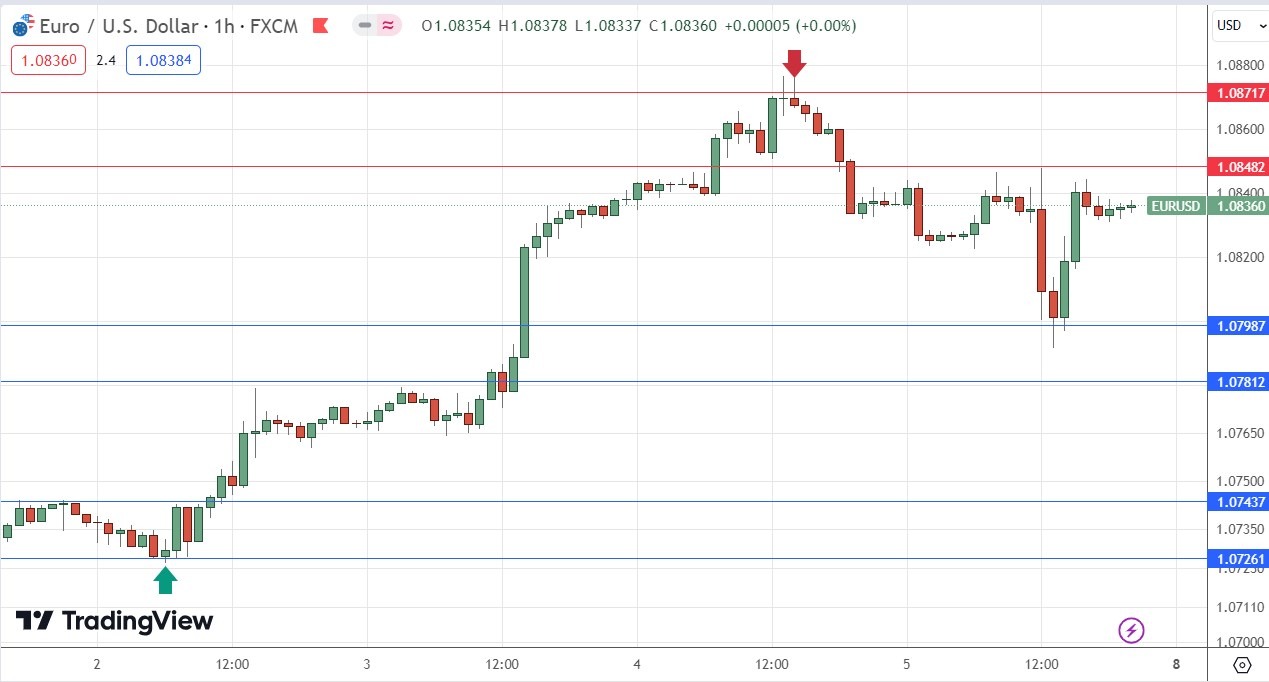
I expected that the EUR/USD currency pair would have potential support at $1.0726 and potential resistance at $1.0872.
The H1 price chart below shows how the $1.0726 level was rejected right at the start of last Tuesday’s London session by a doji candlestick, marked by the up arrow in the price chart below, signaling the timing of this bullish rejection. This can be an excellent time of day to enter a trade in a major currency pair, especially one which involves the Euro.
This trade was very profitable, with a maximum reward-to-risk ratio of more than 13 to 1 based on the size of the entry candlestick.
The price then turned bearish after reaching the resistance level at $1.0872, which the price rejected with a bearish inside pin bar. This produced another profitable trade just after Thursday’s New York open, with a reward to risk ratio in excess of 6 to 1.
USD/CAD
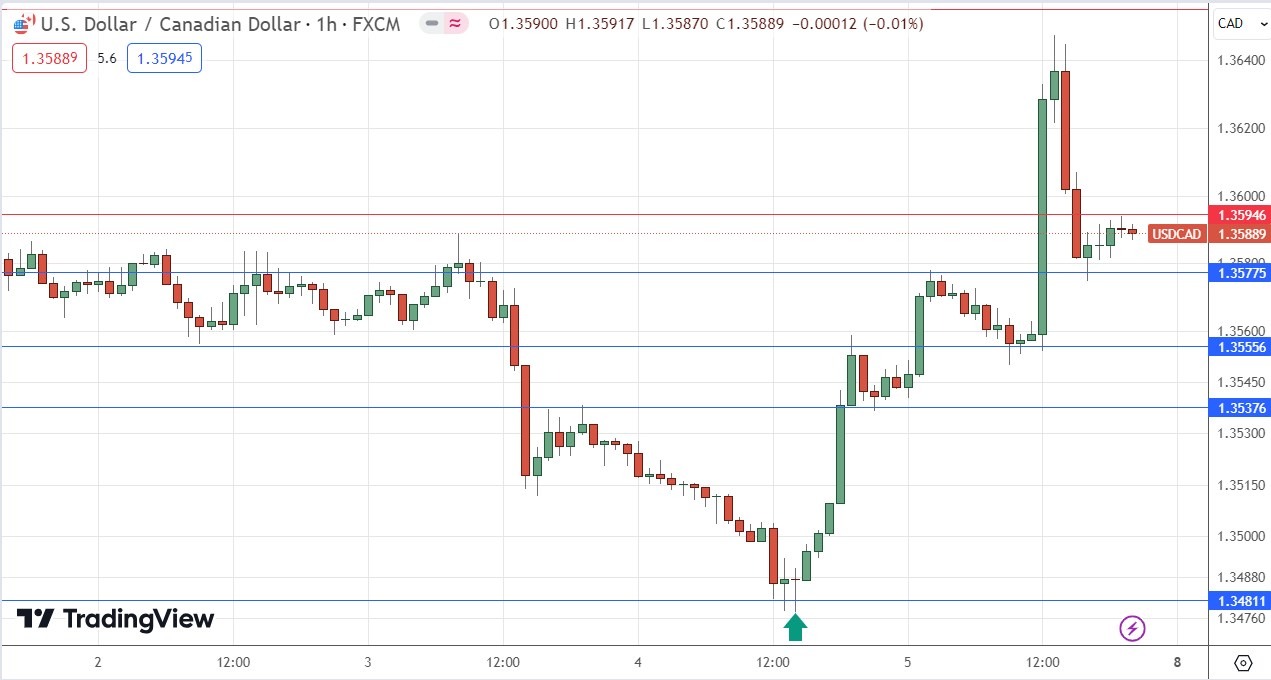
I expected that the USD/CAD currency pair would have potential support at $1.3481 and potential resistance at $1.0872.
The H1 price chart below shows how this level was rejected just after the start of last Thursday’s London / New York session overlap session by a pin bar, marked by the up arrow in the price chart below, signaling the timing of this bullish rejection. This can be an excellent time of day to enter a trade in a major currency pair, especially one which involves the US Dollar.
This trade was very profitable, with a maximum reward-to-risk ratio of more than 10 to 1 based on the size of the entry candlestick.
USD/JPY
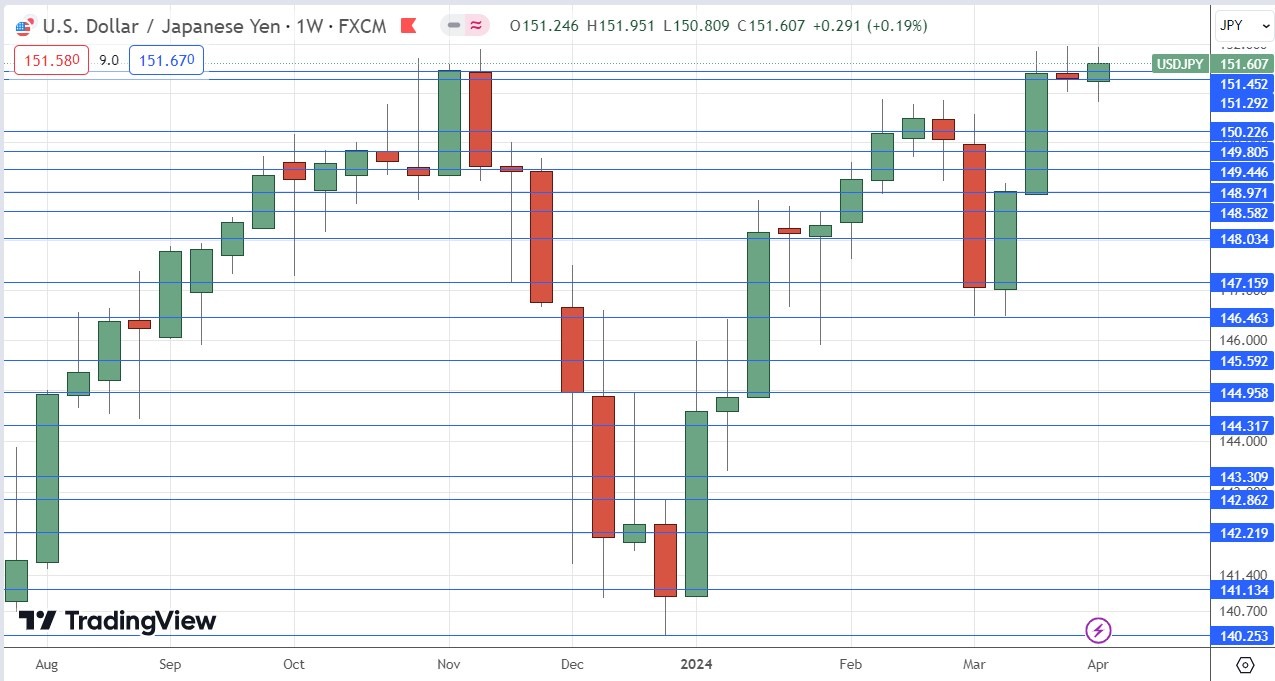
The USD/JPY currency pair made a new 34-year high closing price last week but remains stuck below the 34-year high price just under ¥152. The Bank of Japan and the Japanese Finance Ministry are determined to prevent the Yen from weakening much further, which it seems liable to do despite the recent rake hike and abandonment of an ultra-loose monetary policy by the Bank of Japan over recent weeks.
Key support levels continue to hold, and trend traders and other investors and traders are still entering long trades or at least holding onto them. However, the above resistance at ¥152 seems to be a formidable barrier, so it is unclear which will give way first - ¥152 or the support level at ¥151.17.
I would wait for the price to get established above ¥152 before entering any new long trade here.
WTI Crude Oil
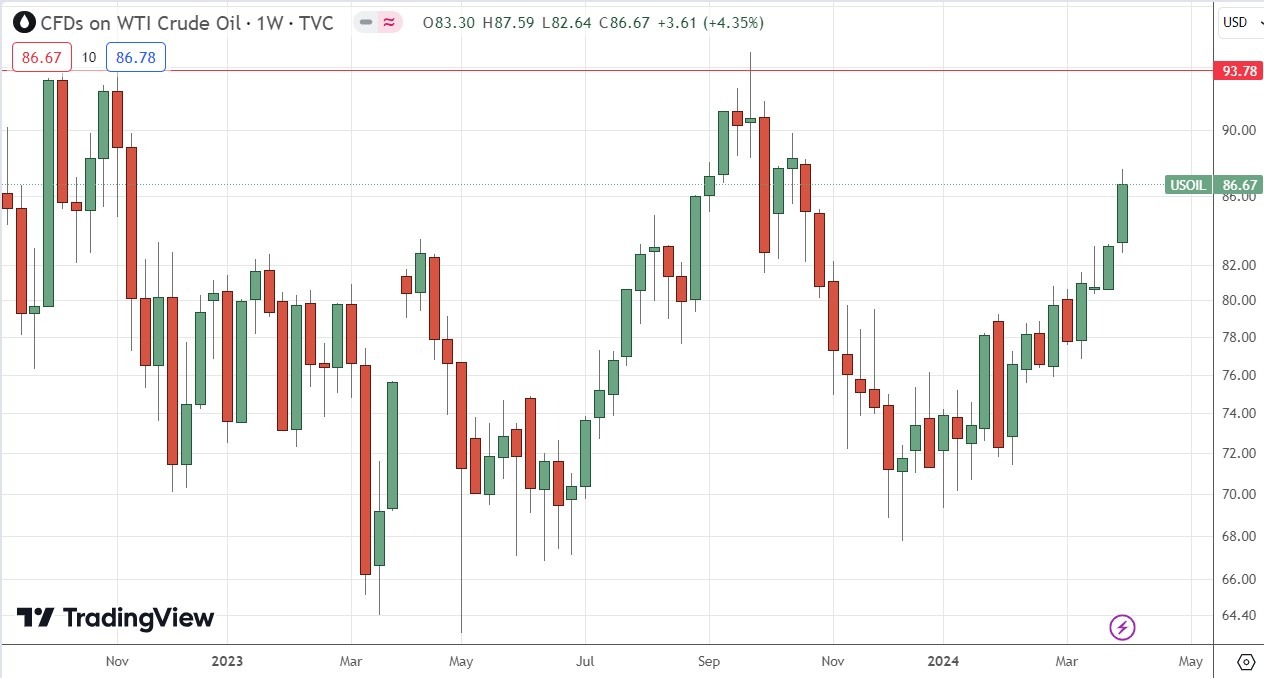
WTI Crude Oil advanced again last week to reach a new 5-month high. Last week closed quite near the high of its range, and its bullish movement was unusually large, but not strongly exceeding the normal range.
I prefer to wait for new 6-month high prices in commodities before going long, but there is certainly bullish momentum here, helped by better Chinese economic data which is leading the market to see future demand as higher.
The resistance area at $93 is very significant, so in the unlikely even that the price reaches it, I think bulls will struggle to push the price any higher for some time afterwards.
Cocoa Futures
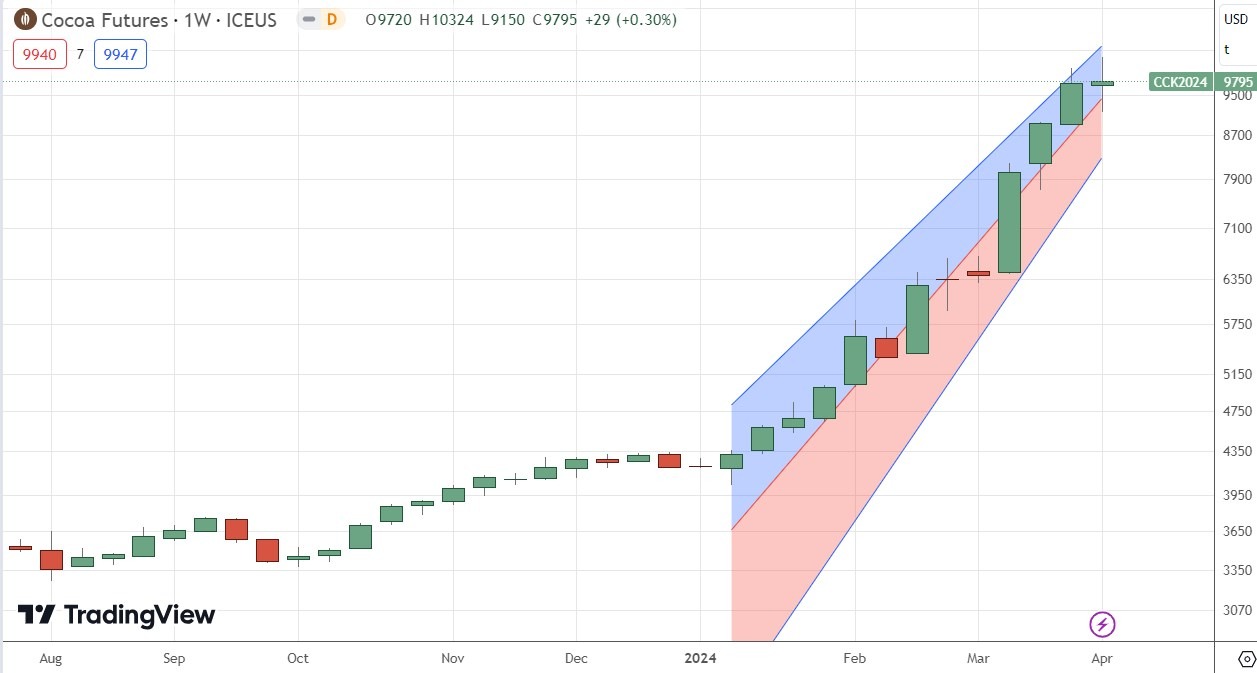
Cocoa Futures made yet another bullish move last week and rose to reach a new multiyear high. The price then gave up most of its gains later in the week.
You can apply a linear regression analysis to the start of the increased bullish momentum 14 weeks ago. Since then, the price of Cocoa futures has more than doubled! Cocoa is now more expensive pound for pound than Copper.
Cocoa is trading not far from its all-time high, but it has seen a fairly deep bearish retracement so it may be wise to wait for a new bullish breakout, which would see a daily close above the record high price at 10324. Using a trailing stop in this kind of trade is extremely important.
Bottom Line
I see the best trading opportunities this week as follows:
- Long of the NASDAQ 100 Index following a daily close above 18400.
- Long of Bitcoin, following a daily close above $74,000.
- Long of Gold.
- Long of Silver.
- Long of the USD/JPY currency pair following a daily close above ¥152.
- Long of Cocoa Futures, but with only half a normal position size, following a daily close above 10,324.
Ready to trade our weekly Forex analysis? We’ve made a list of the best brokers to trade Forex worth using.
