My previous BTC/USD signal on 10th April produced a losing short trade from the rejection of the resistance level at $70,480.
Today’s BTC/USD Signals
- Risk 0.75% per trade.
- Trades must be entered before 5pm Tokyo time Thursday.
Long Trade Ideas
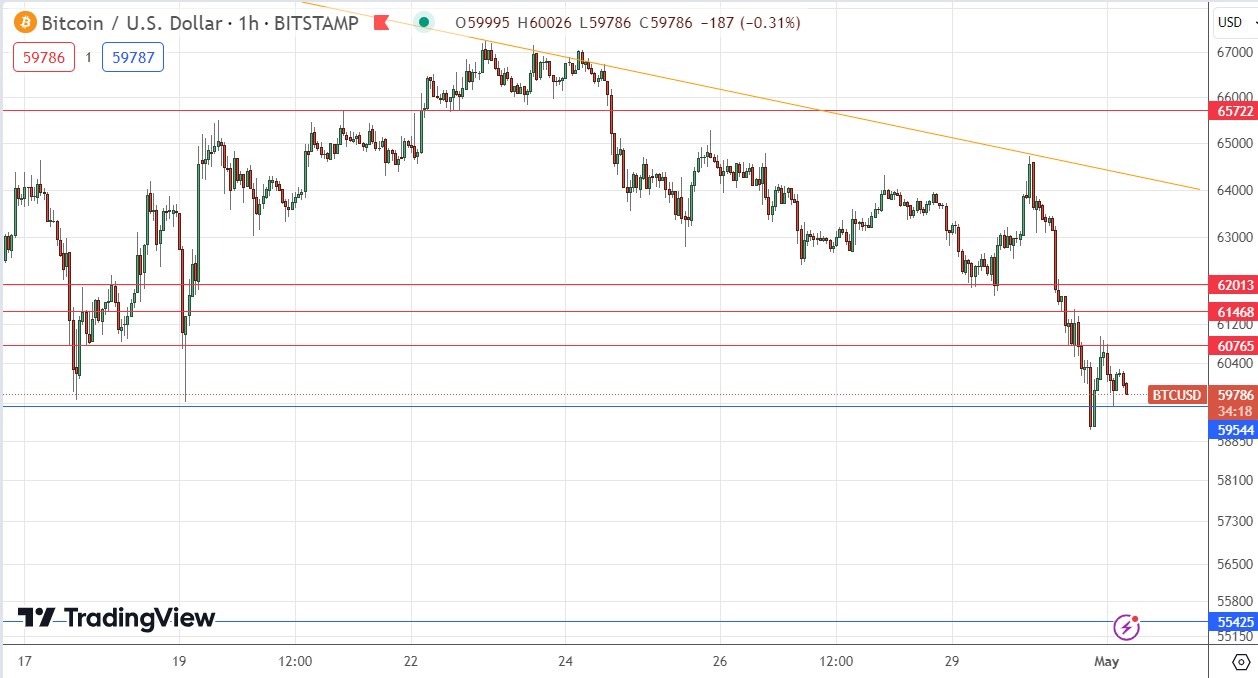
- Long entry after a bullish price action reversal on the H1 timeframe following the next touch of $59,544 or $55,425.
- Place the stop loss $100 below the local swing low.
- Adjust the stop loss to break even once the trade is $100 in profit by price.
- Remove 50% of the position as profit when the trade is $100 in profit by price and leave the remainder of the position to ride.
Short Trade Ideas
- Go short after a bearish price action reversal on the H1 timeframe following the next touch of $60,765 or $61,468, or $62,013.
- Place the stop loss $100 above the local swing high.
- Adjust the stop loss to break even once the trade is $100 in profit by price.
- Remove 50% of the position as profit when the trade is $100 in profit by price and leave the remainder of the position to ride.
The best method to identify a classic “price action reversal” is for an hourly candle to close, such as a pin bar, a doji, an outside or even just an engulfing candle with a higher close. You can exploit these levels or zones by watching the price action that occurs at the given levels.
Top Forex Brokers
BTC/USD Analysis
I wrote in my previous BTC/USD analysis about three weeks ago that the best opportunity was likely to be a bearish breakdown below the ascending trend line and the horizontal support level at $68,507. This was a good call over the longer term, as the bearish breakdown eventually came, but it did not come that day.
The technical picture has become much more bearish and seems to have reached a crucial point as the price weighs heavy on an area of support confluent with the round number at $69,000. This area has acted as support over recent week, holding several times, but seems ripe for a breakdown.
There are no support levels below until about $55,000 so the price has quite a lot of room to fall.
This bearishness is part of a longer-term pattern of a topping out above $70,000. The price chart below is dominated by a descending bearish trend line, and new lower resistance levels printed by the price action.
There are fundamental and sentimental reasons which reinforce the bearish technical picture:
- Risky assets, especially commodities, are selling off, and Bitcoin is no exception.
- The US Dollar is strong, trading very close to its 6-month high.
- The Federal Reserve is taking a hawkish approach, which tends to boost the US Dollar against risky assets such as Bitcoin.
So, I will look for a short trade today. The best entry signal will probably be two consecutive lower hourly closes below $59,000. This will be likely to lead to a sharp drop if it happens, hopefully allowing some quick profit for day traders.
Regarding the US Dollar, there will be releases today of the ADP Non-Farm Employment Change forecast at 1:15pm London time, Final Manufacturing PMI at 2:45pm, ISM Manufacturing PMI and JOLTS Job Openings at 3pm, and the Federal Funds Rate and FOMC Statement at 7pm.
Ready to trade our daily Bitcoin signals? Here’s our list of the best Bitcoin brokers worth reviewing.


