Bullish view
- Buy the BTC/USD pair and set a take-profit at 63,450.
- Add a stop-loss at 60,000.
- Timeline: 1-2 days.
Bearish view
- Sell the BTC/USD pair and set a take-profit at 60,000.
- Add a stop-loss at 63,450.
Bitcoin’s deep slumber continued during the weekend amid a lack of a clear catalyst to propel it higher. The BTC/USD pair was trading at the 61,000 level on Monday, a few points above last week’s low of 60,183.
Bitcoin’s price action has diverged from American equities as the correlation has faded. US stock indices like the Dow Jones, S&P 500, and Nasdaq 100 have rallied for three straight weeks and are all nearing their all-time highs.
This trend happened after the US published weak economic numbers, signaling that the Federal Reserve may start cutting interest rates earlier than expected. Stocks have also been helped by the ongoing earnings season, which has shown robust earnings growth.
At the same time, Bitcoin has had no positive catalyst to push its price higher this year. In contrast, the recent numbers have not been good, with most Bitcoin ETFs seeing strong outflows in the past few weeks.
Top Forex Brokers
The next key important catalyst for the BTC/USD pair will be the upcoming US inflation data. Economists polled by Reuters expect the data to show that the country’s inflation remained at steady above 3% in April.
A lower figure than that will raise the possibility that the Fed will cut interest rates earlier than expected. Bitcoin and other risky assets like technology stocks tend to do well when the Fed changes its tune.
BTC/USD technical analysis
The price of Bitcoin has remained in a tight range in the past few weeks. After soaring to a record high of over $73,000 in March, it has continued trading without a defined trend since then.
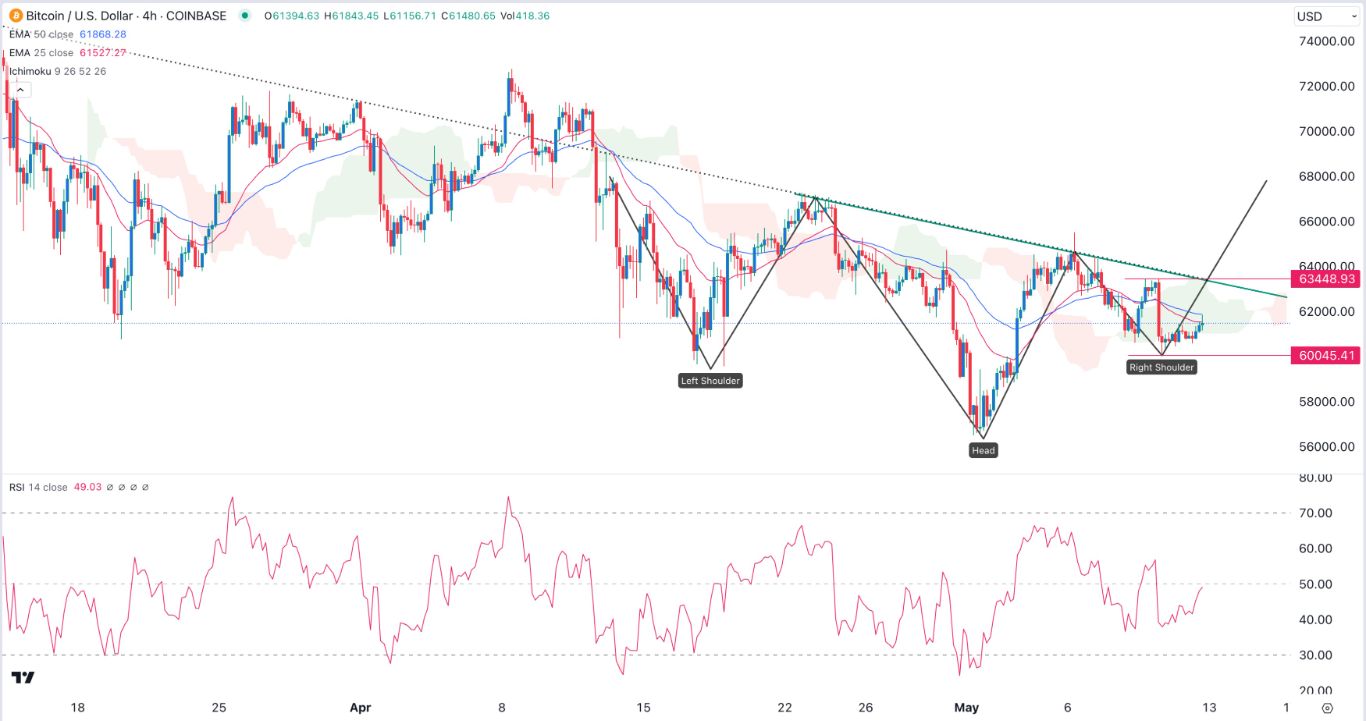
The BTC/USD pair dropped to a low of 60,0045 last week and then bounced back to over 61,000. It has remained below the 25-period and 50-period Exponential Moving Averages (EMA).
The pair has now moved back inside the Ichimoku cloud indicator while the Relative Strength Index (RSI) rose and is nearing the neutral point of 50. On the positive side, the pair has formed an inverse head and shoulders pattern, a positive sign.
Therefore, the pair will likely remain in this range this week. The key support and resistance levels to watch will be at 60,000 and 63,450, its highest swing on May 10th.
Ready to trade our free Forex signals? Here are the best MT4 crypto brokers to choose from.


