Bearish view
- Sell the BTC/USD pair and set a take-profit at 55,000.
- Add a stop-loss at 61,000.
- Timeline: 1-2 days.
Bullish view
- Buy the BTC/USD pair and set a take-profit at 62,000.
- Add a stop-loss at 54,000.
Top Forex Brokers
Bitcoin made a strong bearish breakout as it moved below the crucial support level at $60,000. The BTC/USD pair was trading at 57,847 on Thursday morning, its lowest level since February 26th. It has dropped for five straight weeks and has just moved to a bear market, which is defined as a 20% drop from a recent highest point.
Bitcoin’s sell-off continued after the Federal Reserve delivered its interest rate decision. As was widely expected, the bank decided to leave interest rates unchanged between 5.25% and 5.50%. Officials noted that they were still data-dependent before deciding when to cut interest rates.
Federal Reserve actions are important because they affect all financial assets. The US dollar index (DXY) and Treasury yields have jumped while US equities have remained under intense pressure. Key indices like the Dow Jones and Nasdaq 100 have dropped by over 5% from their highest points this year.
Bitcoin price forecast (weekly chart)
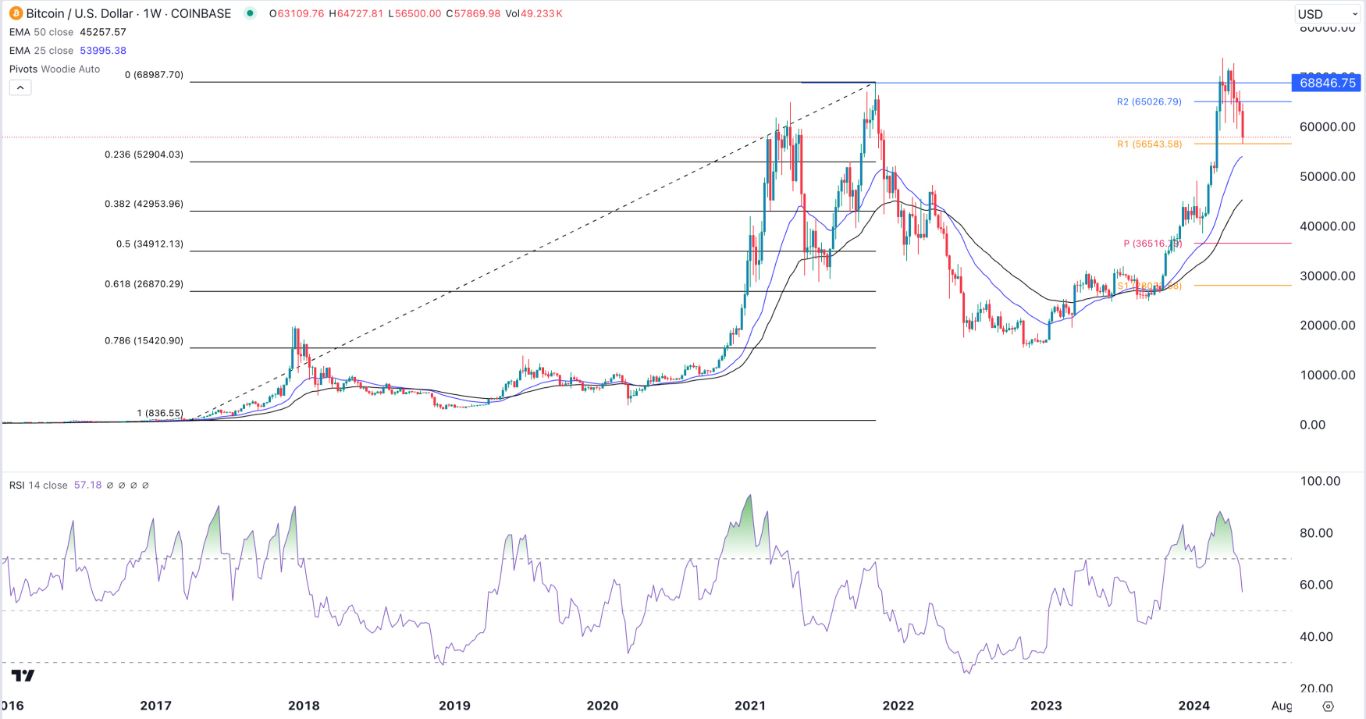
The BTC/USD pair has pulled back sharply in the past five weeks amid Federal Reserve and ETF inflow risks. It has retreated from the year-to-date high of over 73,500 to about 57,500 on Wednesday.
The pair has remained above the 50-week and 25-week Exponential Moving Averages (EMA), which is a positive sign. At the same time, the Relative Strength Index (RSI) and the Stochastic Oscillator have all pointed downwards.
The pair has dropped to the first resistance of the Woodie pivot point. It has remained slightly above the 23.6% Fibonacci Retracement level.
Therefore, the pair will likely remain under pressure this week. Positively, the pair is forming a cup and handle pattern, a popular sign of a bullish continuation. It is now in the handle section of this pattern.
Therefore, in the longer term, the pair will likely bounce back and possibly retest its highest point of the year.
BTC/USD analysis (daily chart)
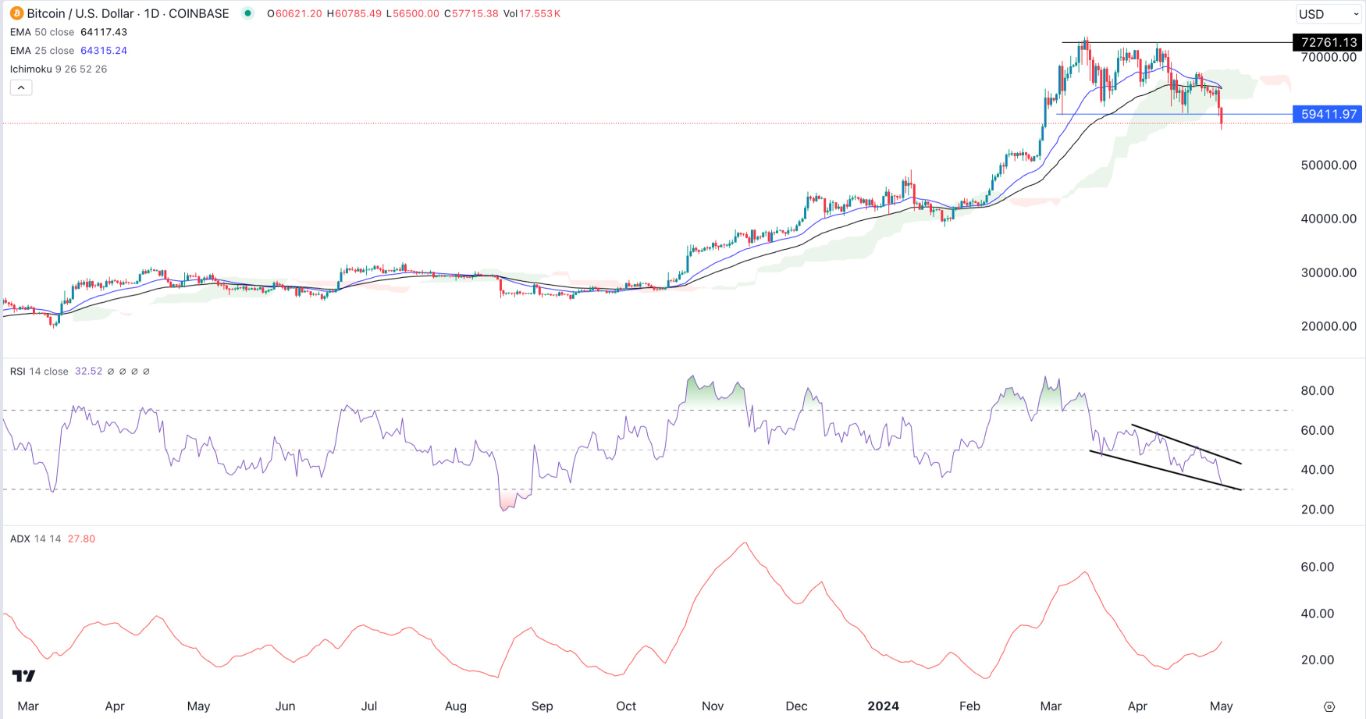
Turning to the daily chart, we see that the BTC/USD pair formed a double-top pattern, which is a popular reversal sign. It has now dropped below the crucial support level at 59,410, the neckline of this double-top pattern.
The 25-day and 50-day moving averages have formed a bearish crossover pattern. Also, the Relative Strength Index has formed a descending channel, which is a sign that bears are gaining momentum.
Bitcoin has moved below the Ichimoku cloud indicator while the Average Directional Index (ADX) has moved to over 27. That is a sign that the downtrend is strong. Therefore, the pair will likely continue falling as sellers target the key support at 55,000.
Ready to trade our free daily Forex trading signals? We’ve shortlisted the best MT4 crypto brokers in the industry for you.


