Bearish view
- Sell the BTC/USD pair and set a take-profit at 67,265.
- Add a stop-loss at 72,000.
- Timeline: 1 day.
Bullish view
- Set a buy-stop at 70,200 and a take-profit at 73,000.
- Add a stop-loss at 67,000.
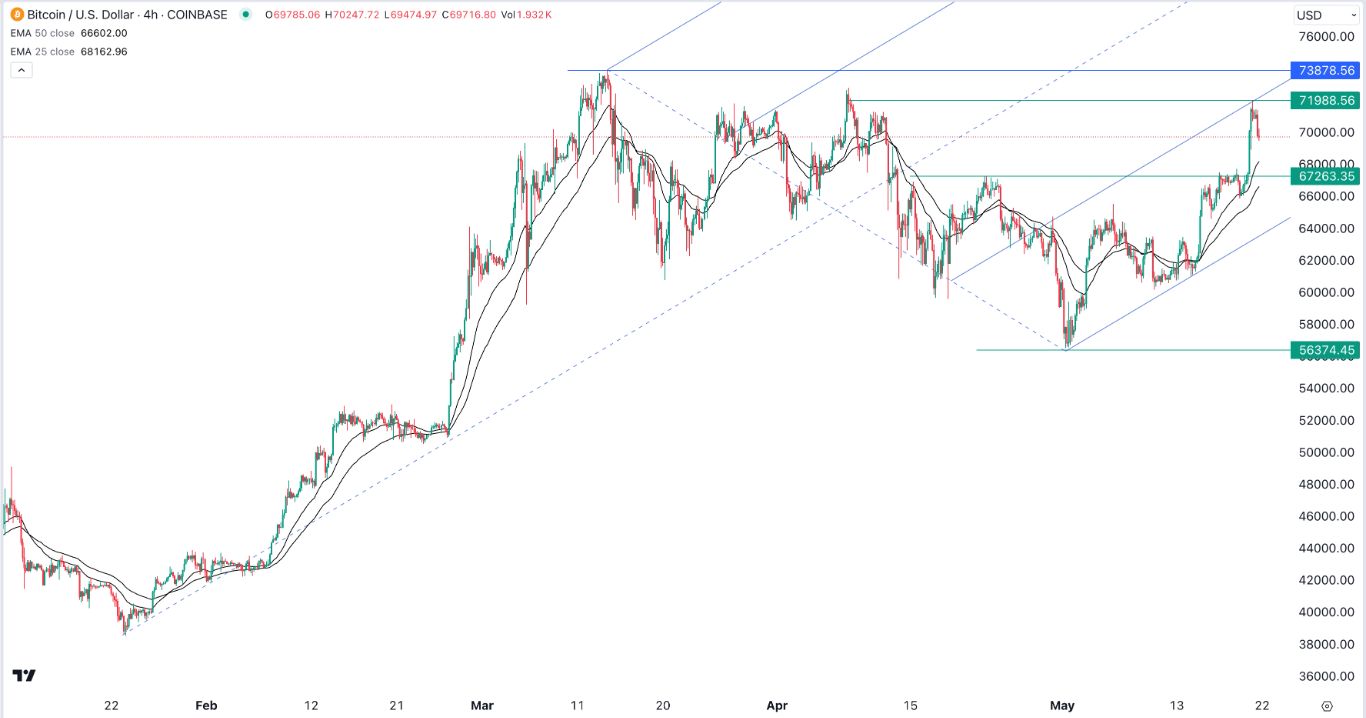
Bitcoin price pulled back on Wednesday morning as the recent bull run faded. The BTC/USD pair initially surged to almost $72,000 on Tuesday and then pulled back to 69,500. This price mirrored the performance of other cryptocurrencies and US equities, which remained in a tight range.
Federal Reserve minutes ahead
The BTC/USD pair surged hard this week as investors remained fixated on the potential approval of Ether ETFs. There have been speculation that the Securities and Exchange Commission (SEC) will approve these funds in the coming weeks or months.
The main concern for these ETFs is that the SEC views Ether as an unregulated security because of its staking features. Staking is a process where crypto holders delegate their coins to help secure the network and earn a reward in return.
The SEC may still decide to approve these funds after gathering lessons from its approval of spot Bitcoin ETFs in January. Since then, these ETFs have traded in sync with each other and added billions of dollars in assets.
Top Forex Brokers
The next potential catalyst for Bitcoin and other assets will be Nvidia’s earnings scheduled for Wednesday after the market closes. Nvidia has become one of the most important companies in Wall Street because it is the biggest player in the semiconductor and artificial intelligence industry.
Bitcoin will also react to the upcoming FOMC minutes, which will provide more information about the last meeting. In that meeting, the bank decided to leave interest rates unchanged between 5.25% and 5.50% and hinted that a rate cut will come later this year.
Bitcoin does well when the Fed has turned dovish, which is one reason it has jumped after the US published weak inflation numbers last week.
BTC/USD technical analysis
The BTC/USD pair has rebounded sharply after bottoming at 56,375 earlier this month. It crossed the key resistance point at 67,265 on Monday as hopes of Ethereum ETF approval rose. That price was along the neckline of the inverse head and shoulders pattern. It jumped to a high of 71,988, which coincided with the first support of the Andrew’s pitchfork tool.
The pair has remained above the 25-period and 50-period moving averages on the four-hour chart. Therefore, the most likely scenario is where it forms a break and retest pattern and moves back to 67,265. If this happens, it will then rebound and resume the previous uptrend.
Ready to trade our daily Forex signals? Here’s a list of some of the best crypto brokers to check out.


