Bearish view
- Sell the EUR/USD pair and set a take-profit at 1.0710.
- Add a stop-loss at 1.0900.
- Timeline: 1-2 days.
Bullish view
- Set a buy-stop at 1.0820 and a take-profit at 1.0900.
- Add a stop-loss at 1.0750.
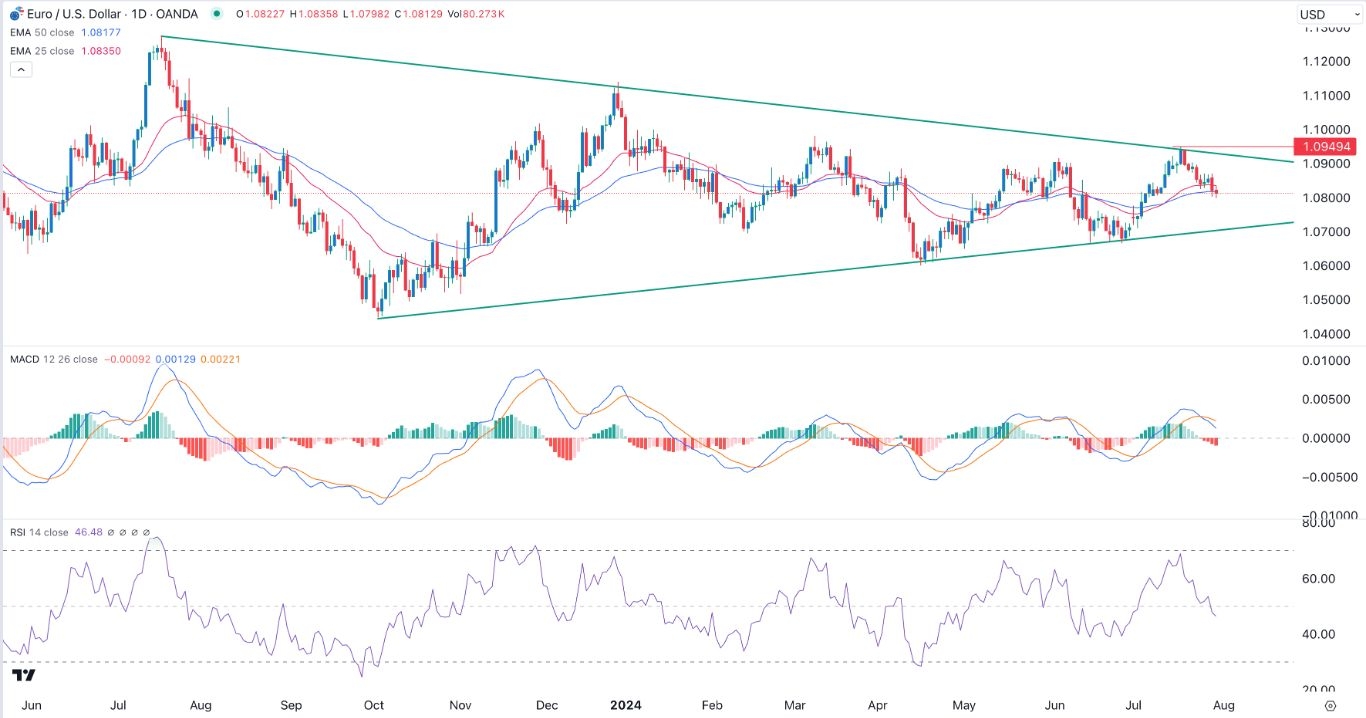
The EUR/USD exchange rate continued falling this week as traders reacted to Tuesday’s vital data from the US and Europe. It dropped to the key support of 1.0800, dowm from this month’s high of 1.0950.
Fed decision ahead
The US published a set of encouraging economic data on Tuesday. In a report, the Conference Board said that the country’s consumer confidence rose from 97.8 in June to 100.3 in July, higher than the expected 99.7.
A separate report by the Bureau of Labor Statistics (BLS) revealed that the number of job openings dropped to 8.14 million in June, down from 8.23 million in May. The drop was better than the expected 8.02 million.
Top Forex Brokers
These numbers came as the Federal Reserve started its two-day monetary policy meeting, which decision will come out on Wednesday. Most economists expect the Fed will leave rates unchanged in this meeting.
The expectation is that the bank will wait for Friday’s NFP data and the next inflation reports to signal its next moves. It will use the Jackson Hole Symposium to signal whether it will cut rates in its September meeting.
Meanwhile, in Europe, several countries published mixed economic data. The German economy remained in a technical recession in Q2 as the GDP contracted by 0.1%. Inflation also rose slightly in the country to 2.3%, higher than the expected 2.2%. The European economy grew by 0.3% in Q2 and by 0.6% on a YoY basis.
The next important data to watch on Wednesday will be the flash European inflation report and the ADP private payrolls numbers. Analysts expect the bloc’s inflation rose 2.5% in July while the core figure dropped to 2.8%.
EUR/USD technical analysis
The EUR/USD pair retreated to a low of 1.0812 on Wednesday morning, its lowest point since July 10. On the daily chart, it is consolidating at the 50-day and 25-day Exponential Moving Averages (EMA).
The two lines of the MACD indicator have formed a bearish crossover while the Relative Strength Index (RS) moved below the support at 50. Also, the pair has formed a symmetrical triangle pattern.
Therefore, the path of the least resistance is downwards as traders target the lower side of the triangle pattern at 1.0710. The alternative scenario is where the pair bounces back and retests the upper side of the triangle at 1.0900.
Ready to trade our daily Forex signal? Check out the best forex brokers in Europe worth using.


