Bullish view
- Buy the BTC/USD pair and set a take-profit at 62,000.
- Add a stop-loss at 60,000.
- Timeline: 1-2 days.
Bearish view
- Sell the BTC/USD pair and set a take-profit at 56,000.
- Add a stop-loss at 62,000.
Bitcoin price continued to underperform other assets like stocks as the recent consolidation accelerated. The BTC/USD pair was trading at 59,000, where it has been stuck at in the past two weeks. It still remains in a local bull market after rising by 20% from its lowest point this month.
Bitcoin continued to consolidate as its divergence with US equities gained steam. The three key indices rose by over 0.50% as they approached their highest levels on record. In the past, Bitcoin had a close correlation with US equities.
Top Forex Brokers
The BTC/USD pair also remained in a tight range as the US dollar index (DXY) tumbled by 60 basis points to $101.73. It has dropped from the year-to-date high of over $106 and this trend may continue falling.
In theory, Bitcoin should continue rising when the US dollar index is in a steep downward trend. One of the most popular reasons for investing in Bitcoin is that it is a good alternative to the greenback.
The BTC/USD pair will next react to the upcoming Federal Reserve minutes and the Jackson Hole Symposium. These events will provide more information on the upcoming Federal Reserve cuts, which could be a turning point for stocks and other risky assets.
BTC/USD technical analysis
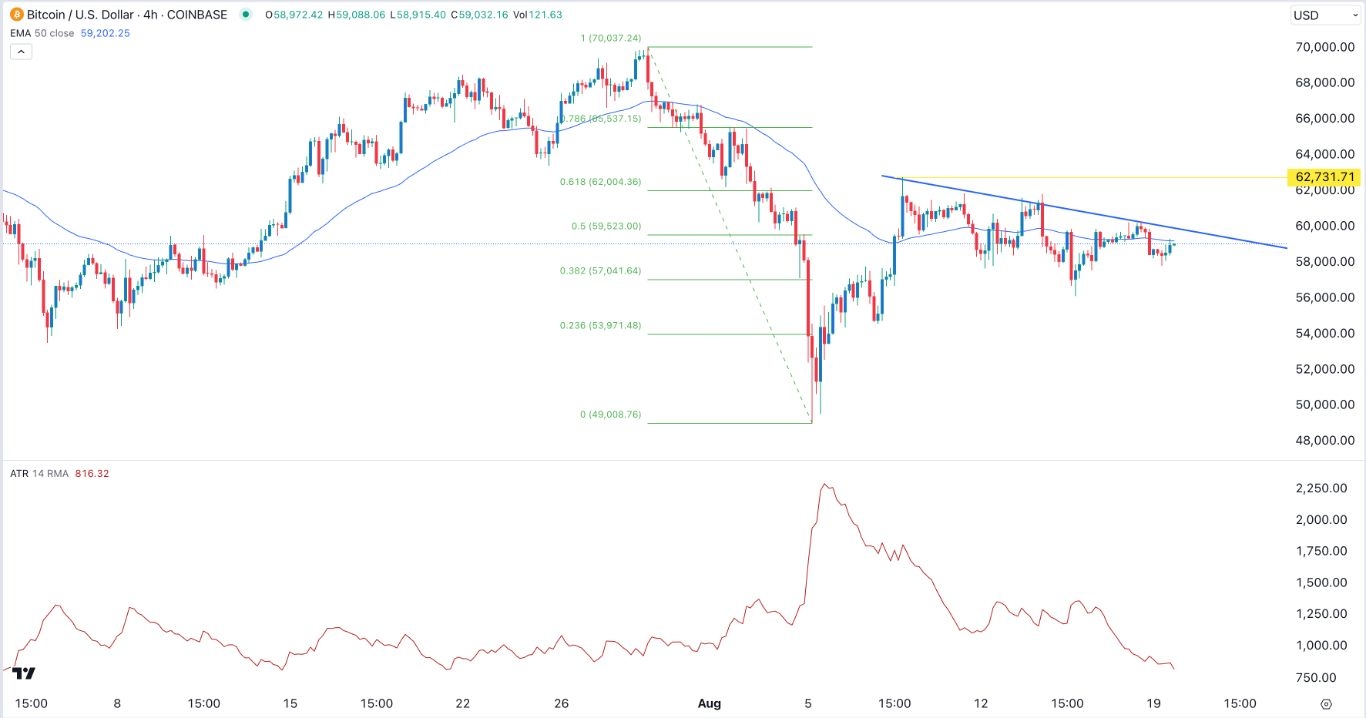
On the four-hour chart, we see that the Bitcoin price has consolidated in the past few days. It has also moved slowly from the key resistance point at 62,730, its highest point on August 8.
The pair has formed an inverse head and shoulders pattern, a popular bullish sign. It has moved slightly below the descending trendline shown in blue, which is the neckline of the H&S pattern.
Bitcoin has moved slightly below the 50% Fibonacci Retracement point and the 50-period moving average. The Average True Range (ATR) indicator has continued falling and
Therefore, the outlook for Bitcoin is bullish, with the next point to watch being at the resistance point at 62,730. A break above that level will point to more gains as buyers target the psychological level at 65,000.
The alternate scenario is where the pair invalidates the inverse H&S pattern and drops to thekey support at 56,000.
Ready to trade our daily Forex signals? Here’s a list of some of the best crypto brokers to check out.


