Bullish view
- Buy the BTC/USD pair and set a take-profit at 68,000.
- Add a stop-loss at 62,000.
- Timeline: 1-2 days.
Bearish view
- Set a buy-stop at 63,000 and a take-profit at 60,000.
- Timeline: 68,000.

Bitcoin price made a strong comeback last week, joining other assets like stocks after the dovish Fed Chair statement. The BTC/USD pair rose to $64,000, a strong jump from this month’s low of $49,000.
Bitcoin price jumped after Jerome Powell hinted that the Fed would start cutting interest rates in its September.
That statement pushed US stock indices like the S&P 500 and Nasdaq 100 near their all-time high. Similarly, gold rose to a high of $2,512, a few points below the record high of $2,531.
Top Forex Brokers
In most cases, Bitcoin and other risky assets do well when the Federal Reserve is cutting interest rates. For example, it surged to the then-all-time high of $69,000 in 2021 as the Fed slashed rates and implemented quantitative easing policies.
The BTC/USD pair also rose after Robert F Kennedy dropped out of the presidential race and endorsed Donald Trump. This was a notable endorsement because most analysts believe that the election result will be close.
Therefore, there are chances that some of Kennedy’s voters will back Trump in the election. Traders in Polymarket, a popular crypto-based prediction market, has placed Trump’s odds of beating Kamala Harris at 50% while she was at 49%.
Trump is viewed favorably by the crypto community for endorsing Bitcoin and other cryptocurrencies like Ether.
A key risk for Bitcoin and other cryptocurrencies this week is on geopolitics after Israel bombed Lebanon on Sunday.
BTC/USD technical analysis
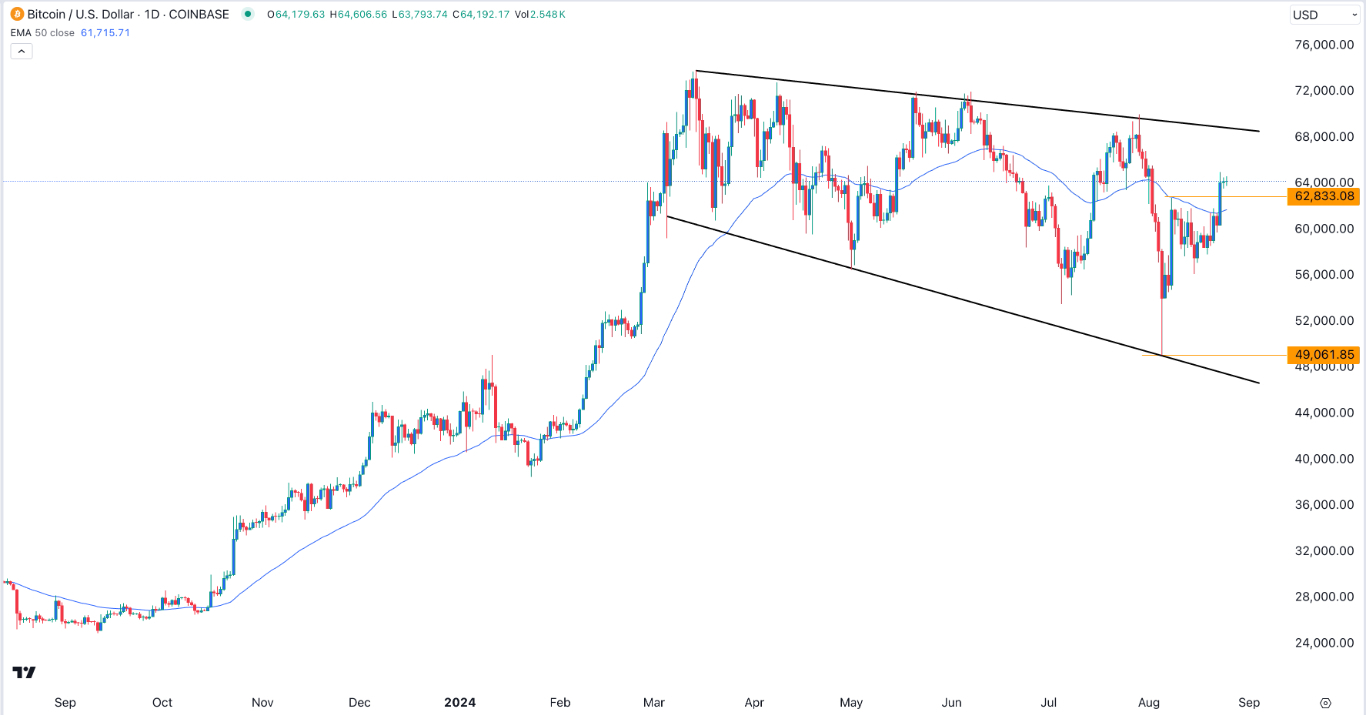
The BTC/USD pair bottomed at 49,000 earlier this month and has now bounced back to over 64,000. It rose above the key resistance point at 62,833, its highest point on August 9, meaning that bulls are gaining momentum.
Bitcoin has also formed a small bullish flag chart pattern, a highly popular bullish sign. In most cases, assets tend to continue rising after forming this pattern.
It has also moved above the 50-day moving average and formed a falling broadening wedge chart pattern. In most cases, this pattern is usually a bullish sign.
Therefore, Bitcoin will likely have a bullish breakout as bulls target the upper side of the wedge pattern at around 68,000. The alternative scenario is where the BTC/USD pair pulls back and retests the support at 60,000.
Ready to trade our free Forex signals? Here are the best MT4 crypto brokers to choose from.
