Bullish view
- Buy the EUR/USD pair and set a take-profit at 1.1100.
- Add a stop-loss at 1.0885.
- Timeline: 1-2 days.
Bearish view
- Sell the EUR/USD pair and set a take-profit at 1.0900.
- Add a stop-loss at 1.100.
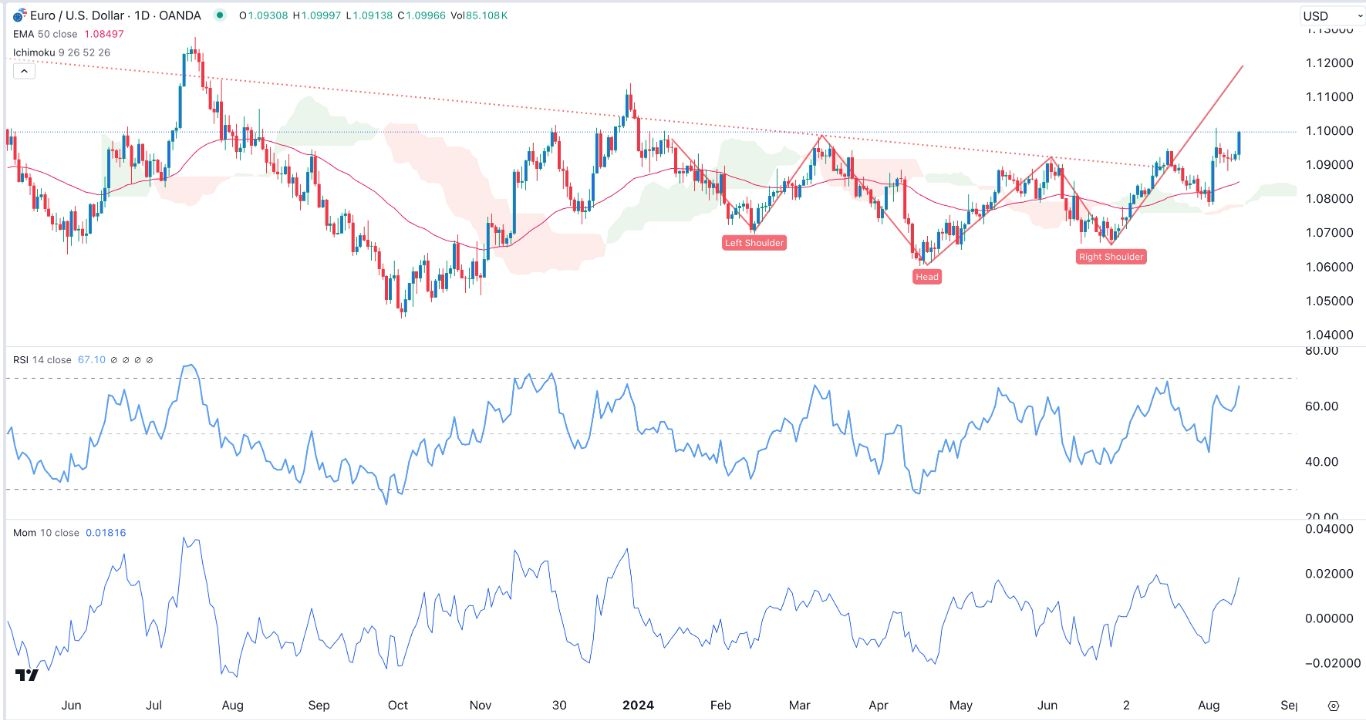
The EUR/USD pair rallied to the psychological resistance point at 1.100, its highest point since January 2nd. It has rallied almost 4% from its lowest swing in April as traders waited for the upcoming European GDP and US inflation data.
European GDP and US inflation report
The EUR/USD exchange rate rose after signs emerged that the US inflation was still falling. A report by the Bureau of Labor Statistics (BLS) revealed that the producer price index retreated sharply in July.
These numbers came ahead of the closely-watched consumer price index (CPI) report, which is expected to show that prices rose slightly in July. Therefore, with the PPI falling, there is a chance that the CPI figure will come out lower than expected.
Top Forex Brokers
The encouraging PPI data pushed the US dollar index to its lowest point in weeks and stocks much higher. Key indices like the Dow Jones, Nasdaq 100, and S&P 500 rose by more than 2% on Tuesday. They have all erased all the losses suffered on Monday last week.
This price action is likely because analysts now expect the Federal Reserve to be more aggressive when it comes to cutting interest rates. The base case is that the Fed will deliver a 0.25% or a 0.50% interest rate cut in its September meeting.
The EUR/USD pair will also react to several other economic numbers from Europe. Eurostat will publish the latest GDP and jobs numbers. Based on the first estimate, analysts expect these numbers to show that the economy expanded by 0.6% in the second quarter.
The other top economic numbers to watch will be the French and Swedish inflation data for July. A sign that the bloc’s inflation is falling will raise the probability of more rate cuts by the European Central Bank.
EUR/USD technical analysis
The EUR/USD pair continued rising after the US PPI inflation report. It rose to a high of 1.100, its highest level since January 2nd. The pair crossed the important resistance point at 1.0900, the neckline of the inverse head and shoulders pattern. In technical analysis, this is one of the most bullish patterns in the market.
The pair has moved above the 50-day moving average while the RSI and momentum indicators have pointed upwards. Therefore, the path of the least resistance for the pair is bearish, with the next level to watch being at 1.1100.
Ready to trade our free Forex signals? Here are the top brokers in Europe to choose from.


