Bearish view
- Sell the GBP/USD pair and set a take-profit at 1.2600.
- Add a stop-loss at 1.3000.
- Timeline: 1-5 weeks.
Bullish view
- Buy the GBP/USD pair and set a take-profit at 1.3000.
- Add a stop-loss at 1.2600.

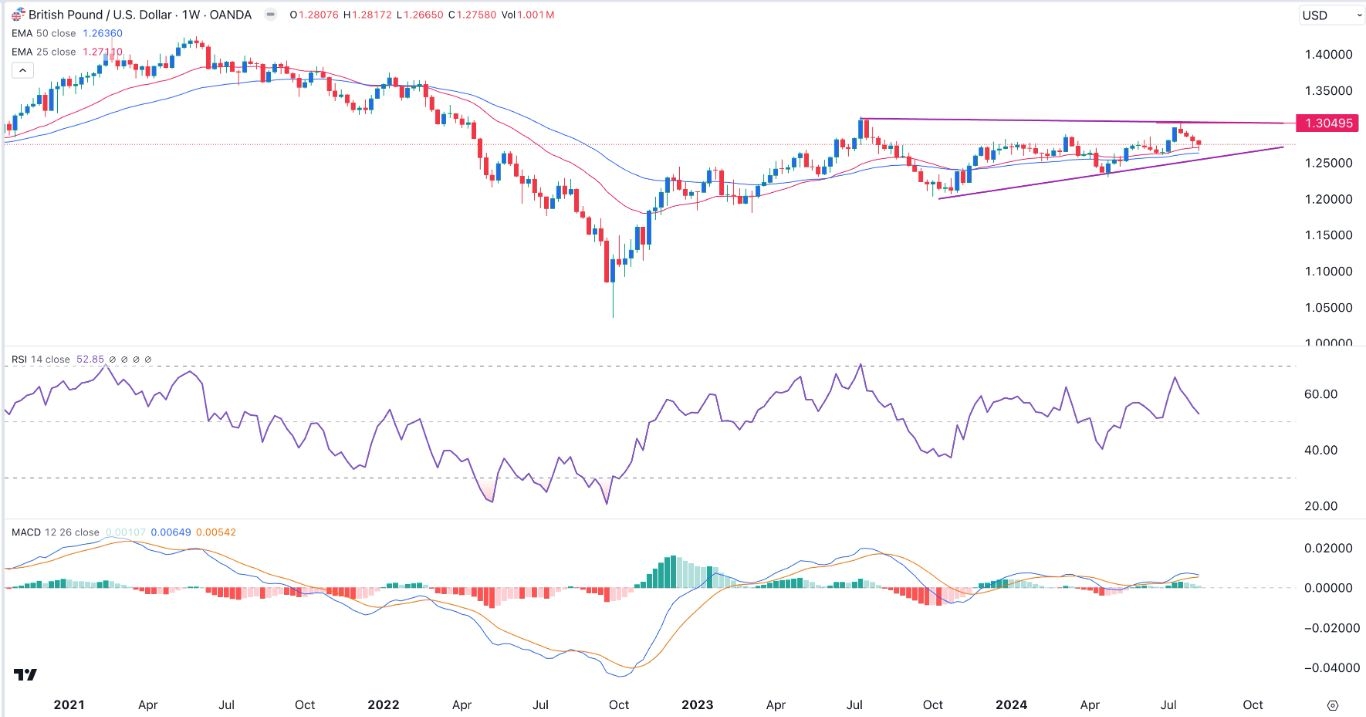
The GBP/USD pair retreated for four consecutive weeks as hedge funds and other speculators reduced their bullish bets on the British pound. It retreated to 1.2758 on Friday, down from the July 15th high of 1.3053.
The latest Commitment of Traders (CoT) report showed that speculators pared back their strong bullish bets on the sterling for the second straight week. The figure came in at 74.4k on Friday, down from 142k two weeks earlier.
This positioning is likely because the Bank of England (BoE) blinked first and slashed interest rates by 0.25% in its last meeting. That cut has widened the spread between US and UK interest rates, creating a brief carry trade opportunity.
Top Forex Brokers
Looking ahead, the GBP/USD pair will be in the spotlight this week as the US and UK publish important economic data that could have an impact on their respective central banks.
The US will publish the latest inflation report on Wednesday. Economists will be watching whether the country’s inflation continued falling in July as it has done in the past three consecutive months.
The estimate is that the CPI remained at 3.0% while the core CPI moved from 3.3% to 3.2% in July. A sign that inflation is falling will raise the chances of the Federal Reserve slashing interest rates in September.
The Office of National Statistics (ONS) will also release the latest UK inflation data. Economists expect the report to show that the headline CPI rose from 2.0% in June to 2.3% in July while the core CPI slipped from 3.5% to 3.4% in July.
These inflation numbers will come as the Bank of England has already started cutting interest rates.
GBP/USD technical analysis
The GBP/USD exchange rate has pulled back in the past four consecutive weeks, a retreat that started when the pair rose to a high of 1.3050 in July. It has found a strong support at the 50-week moving average.
Meanwhile, the two lines of the MACD indicator are about to form a bearish crossover while the Relative Strength Index (RSI) is nearing the neutral point at 50. The pair has also formed a symmetrical triangle indicator.
Therefore, the pair will likely continue falling as traders target the lower side of the triangle pattern at 1.2590.
Ready to trade our weekly forecast? Here’s a list of some of the top forex brokers in the UK to check out.
