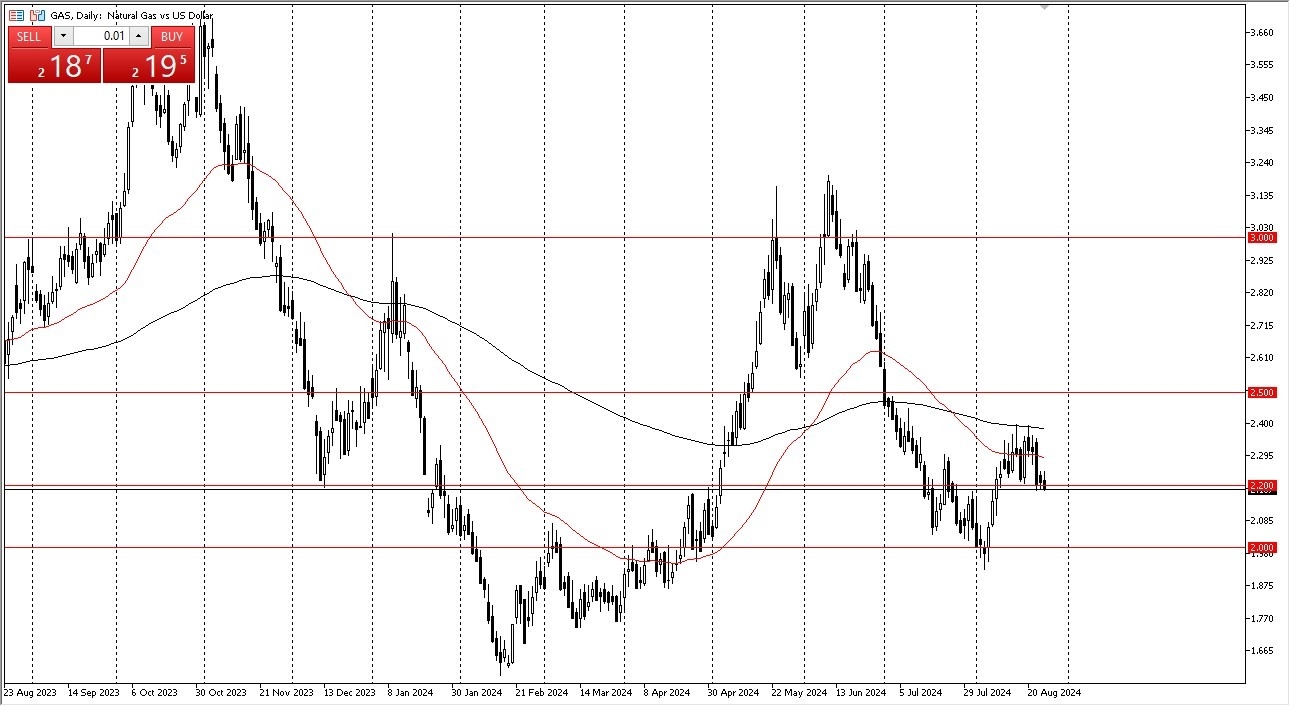
- In my daily analysis of the natural gas markets, the first thing I notice is that this asset is struggling overall, as every time we have rallied over the last couple of weeks, we’ve seen the natural gas markets fall.
- In fact, when you look at the weekly chart, the past 2 weeks have seen shooting stars form, and I think that does suggest that it is probably only a matter of time before we drop.
All things being equal, the market were to continue breaking down from here, it could very easily drop to the $2.00 level, which is a large, round, psychologically significant figure, and therefore I think it would make a lot of sense for us to test that area. The $2.00 level is an area that I think will continue to be crucial, as we had bounce from there and of course it is a large, round, psychologically significant figure, and an area where think you would see a lot of options barriers, and of course a lot of traders willing to “step in and pick up value.”
Cyclical Trade
Top Forex Brokers
Cyclical trade at this point in time is obvious, and therefore I think a lot of people have to pay close attention to it. The market is likely to continue to see a lot of volatility, but I think at this point in time it’s also worth paying close attention to the idea that we are in the slowest part of the year as far as demand is concerned. That being said, as we get later in the year, it’s likely that natural gas will rally again, as we have seen time and time again. After all, as temperatures drop in the northeastern part of the United States, that does drive up the price and demand of natural gas in general. All things being equal, this is a market that I think is still in the process of bottoming out in trying to find enough support to turn things around.
Ready to trade daily Forex forecast? Here’s a list of some of the best commodities brokers to check out.

