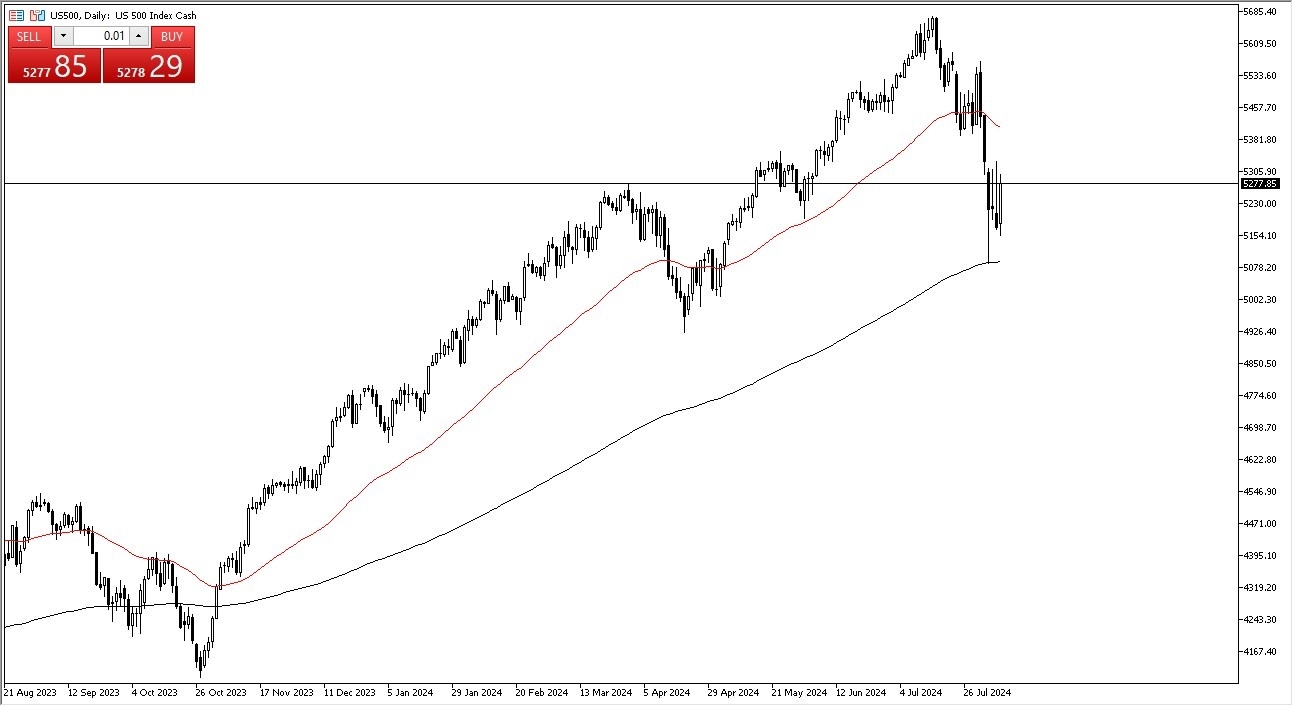
- The S&P 500 was bullish during the early hours on Thursday, but we've seen this over the last couple of days where buyers come in and start buying stocks in the early part of the day, only to fade them later.
- If we see that again, it's very likely that this market will continue to be very negative.
- And if we eventually break down below the 200 day EMA, that is a very negative turn of events.
If you see the market breakdown below there, then you could see a massive sell off and quite a bit of ugliness appear. On the other hand, if we can turn around and break above the 5,350 level, then the market could go look into the 50 day EMA. But keep in mind, there are a lot of concerns out there about the global economy, and I do think that will remain a major problem.
Top Forex Brokers
Bond Yields Continue to Be a Factor
Bond markets, of course, have their part to say. With that being said, I think you've got a situation where fear doesn't necessarily have people jumping into the markets anyway. At the very best, I think you've got probably some sideways action over the next couple of days. Truthfully, that's the best thing you can do when you have a market that's falling apart. Therefore, it allows for a little bit of base building.

The 200 day EMA underneath has held to the point, but if we rally from here, then I anticipate that the 50 day EMA will also be an area that could be very brutal. Typically, when markets trade between the 200 day EMA and the 50 day EMA indicators, things get a little squirrely, and that's exactly what you're seeing now. So, trade with caution. Short term, this is a market that looks very sideways. Longer term, we'll have to see if we can recapture the momentum to the upside.
Ready to trade our stock market forecast? Here are the best CFD brokers to choose from.
