Fundamental Analysis & Market Sentiment
I wrote on 28th July that the best trade opportunities for the week were likely to be:
- Long of the AUD/JPY currency cross. This produced a loss of 5.25%.
- Long of the CAD/JPY currency cross. This produced a loss of 4.96%.
- Long of the EUR/JPY currency cross. This produced a loss of 4.24%.
- Long of the GBP/JPY currency cross. This produced a loss of 5.18%.
- Long of the NZD/JPY currency cross. This produced a loss of 3.55%.
Top Forex Brokers
These trades gave a total loss of 23.18%, averaging a loss of 4.64% per asset.
Last week’s key takeaways were:
- Possibly the most important event was the US Federal Reserve’s policy meeting. There was an overwhelming expectation that interest rates would be left unchanged despite evidence of declining inflationary pressures and a slowing economy. This was proven correct, but it was the Statement and comments from Fed officials that moved markets and created a more dovish tilt on the US Dollar policy outlook. Fed President Jerome Powell made clear that rate cuts are about to begin as there is a risk of the labour market. Markets were already strongly expecting a rate cut at the September Fed meeting, but these comments had an immediate dovish effect, and sent the US Dollar lower, while US treasury yields fell very sharply very quickly. Both the 2-year and 10-year yields are trading well below 4%, with the 2-year yield falling by more than 0.50% in just 3 days. The dovish outlook on the Dollar and rates was reinforced Friday with lower-than-expected average hourly earnings and non-farm payrolls data.
- The Japanese Yen made extremely strong gains again last week, as the Bank of Japan hiked rates by 0.15% to 0.25% and announcing a halving of its bond purchases. Traders pushed the Yen higher by close to 5% over the past week alone, which is an enormous advance in a very short time for a major currency which can act as a safe haven for investors. The Yen is now trading at long-term highs against some major currencies after trading at record lows just a few short weeks ago.
- The Bank of England cuts its interest rate by 0.25% to 5%. The vote was slightly less convincing than was expected, but the cut was widely expected to happen.
- Global equity markets generally fell significantly last week, especially technology stocks, continuing a recent trend. However, it is far from clear that the bull market in stocks in over.
- Inflation data released last week from a few countries gave the following results:
- Eurozone CPI Flash Estimate came in just a fraction higher than expected.
- German Preliminary CPI – as expected.
- Swiss CPI – as expected.
- Australia CPI – as expected.
- Canadian GDP data showed very slightly stronger economic growth than expected.
The Week Ahead: 5th – 9th August
It will be a relatively quiet week in terms of data, with the most important items this coming week expected to be:
- US ISM Services PMI.
- Reserve Bank of Australia Cash Rate, Rate Statement, and Monetary Policy Rate.
- New Zealand Inflation Expectations.
- Canada Unemployment Rate.
- New Zealand Unemployment Rate.
Monthly Forecast July 2024

Last month, I forecasted that the USD/JPY currency pair would increase in value. The performance of this forecast is as follows:

For the month of August, I forecast that the EUR/USD currency pair will rise in value.
Weekly Forecast 4th August 2024
Last week, I forecasted that the following Japanese Yen crosses would rise in value:
- AUD/JPY
- CAD/JPY
- EUR/JPY
- GBP/JPY
- NZD/JPY
I was wrong, as all decreased in value.
This week, I forecast that the following currency crosses will rise in value:
Directional volatility in the Forex market rose again last week, with 67% of the most important currency pairs and crosses fluctuating by more than 1%.
Last week, the Japanese Yen was again the strongest major currency, and the Australian Dollar was again the weakest.
You can trade these forecasts in a real or demo Forex brokerage account.
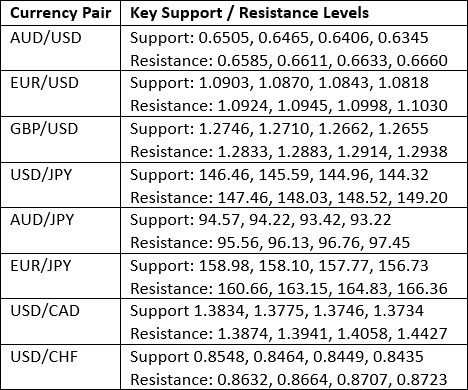
Key Support/Resistance Levels for Popular Pairs
Technical Analysis
US Dollar Index
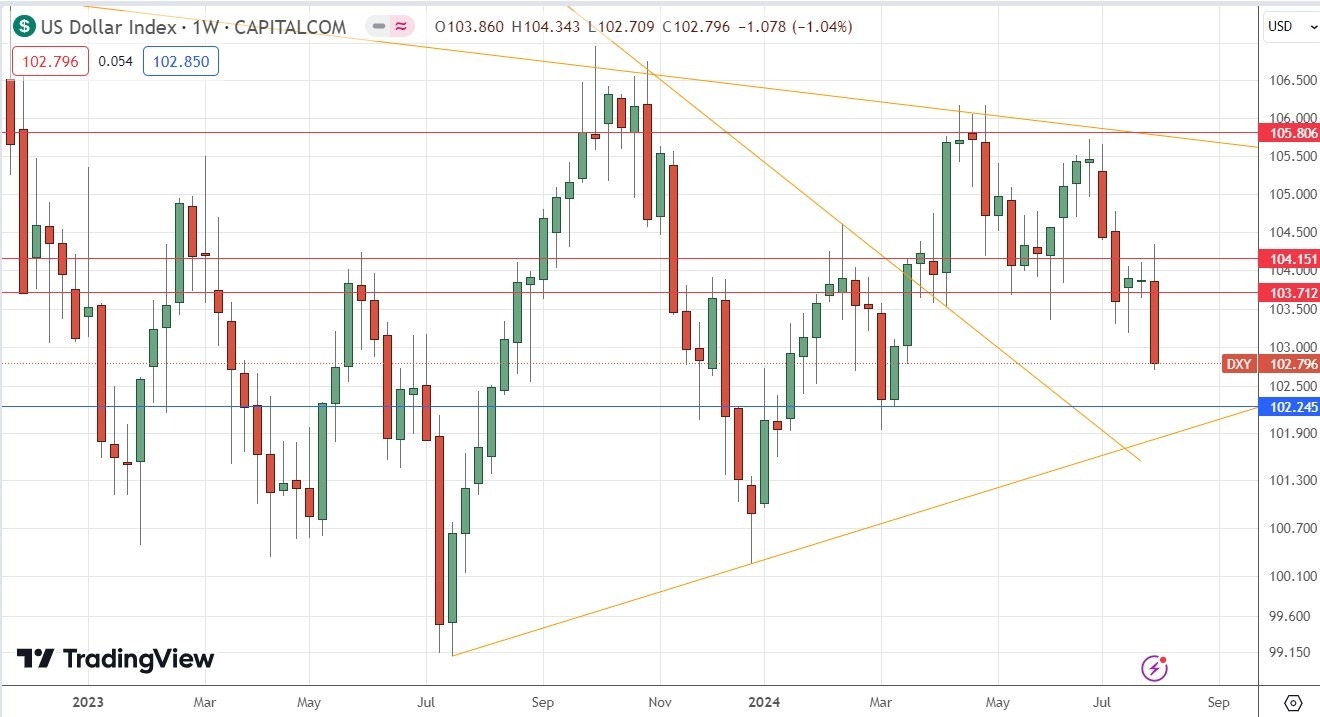
The US Dollar Index printed a large bearish engulfing candlestick last week, which closed right near its low, at the lowest price seen in almost 5 months. The price is now below its levels of both 3 months ago and 6 months ago, indicating a new long-term bearish trend in the greenback. These are all bearish signs.
The technical slip matches the dovish change in fundamentals, with the Federal Reserve making clear that it will soon begin cutting interest rates, and with US treasury yields falling very quickly and sharply after the Fed’s meeting last week. There was also economic data released Friday which clearly indicated that the US economy is slowing significantly.
I am bearish on the US Dollar this week. However, it is worth noting that technically, the price is not very far from both a horizontal support level, and an ascending trend line marking the lower edge of the narrowing triangle chart pattern that has contained the US Dollar for about the past year.
EUR/USD
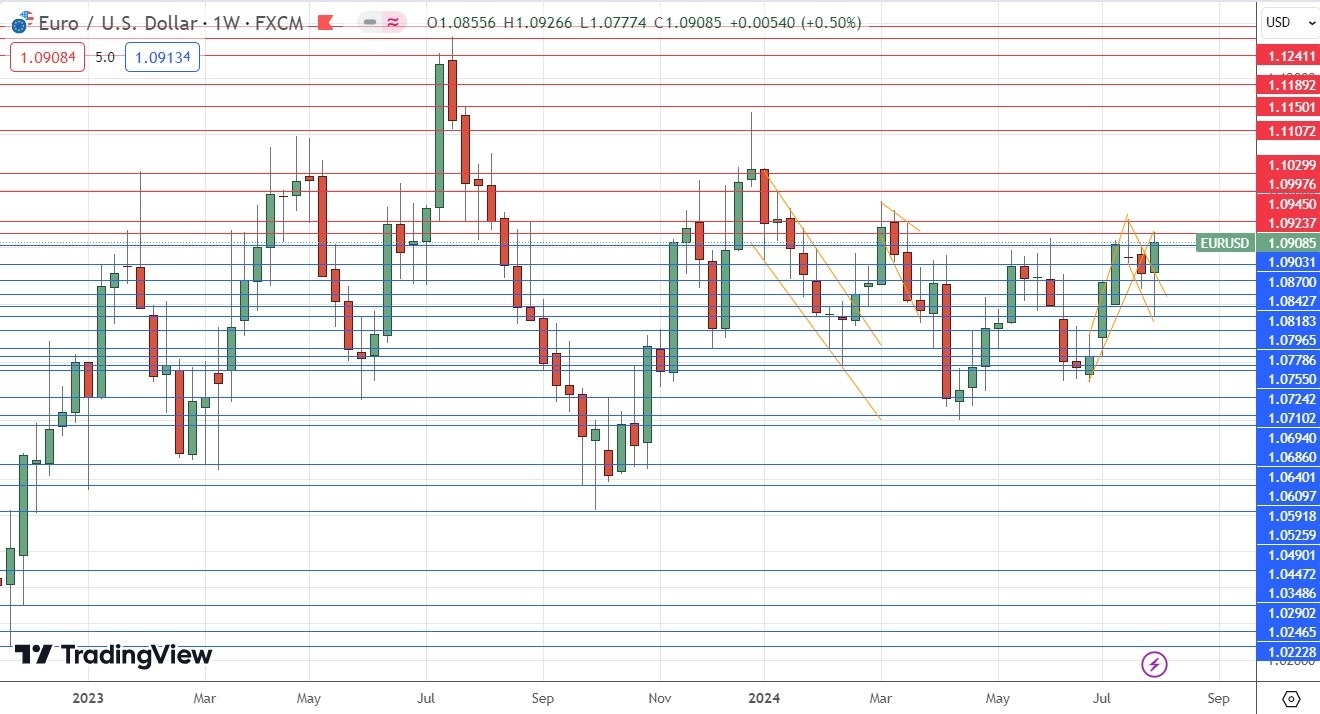
The EUR/USD currency pair rose strongly last week to print a fairly large engulfing candlestick which closed near its high. This is the highest weekly close seen in this currency pair in almost 5 months. These are bullish signs, but bulls should not that according to the price chart below, the price action over the past several months has been rather consolidative.
The Euro tends to trend quite reliably, but often does so slowly, with deep retracements. Nevertheless, I see the current technical situation as justifying entering a new long trade, it just might well take a long time to pay off.
A long position here is supported by the bearish picture both technically and fundamentally in the US Dollar, it is more the Euro which needs to start moving.
USD/CHF
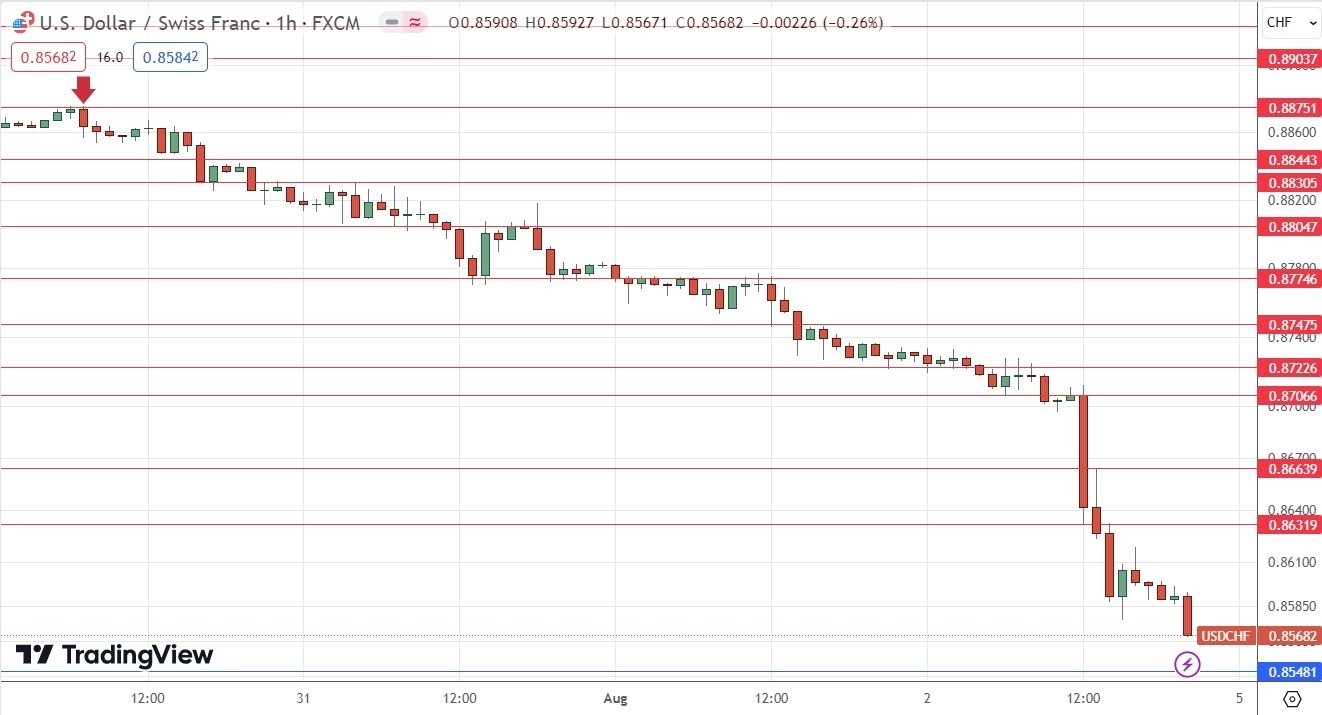
I expected the USD/CHF currency pair to have potential resistance at $0.8875.
The H1 price chart below shows how the price action rejected this resistance level with a large bearish engulfing candlestick, marked by the down arrow within the price chart below, rejecting this resistance level during last Tuesday’s London session, signaling the timing of this bearish rejection.
This trade could still be open, but it has been extremely profitable so far, giving a maximum reward-to-risk ratio of approximately 14 to 1.
Along with the Japanese Yen, the Swiss Franc is a very strong currency, gaining firmly in value over the past week.
AUD/JPY
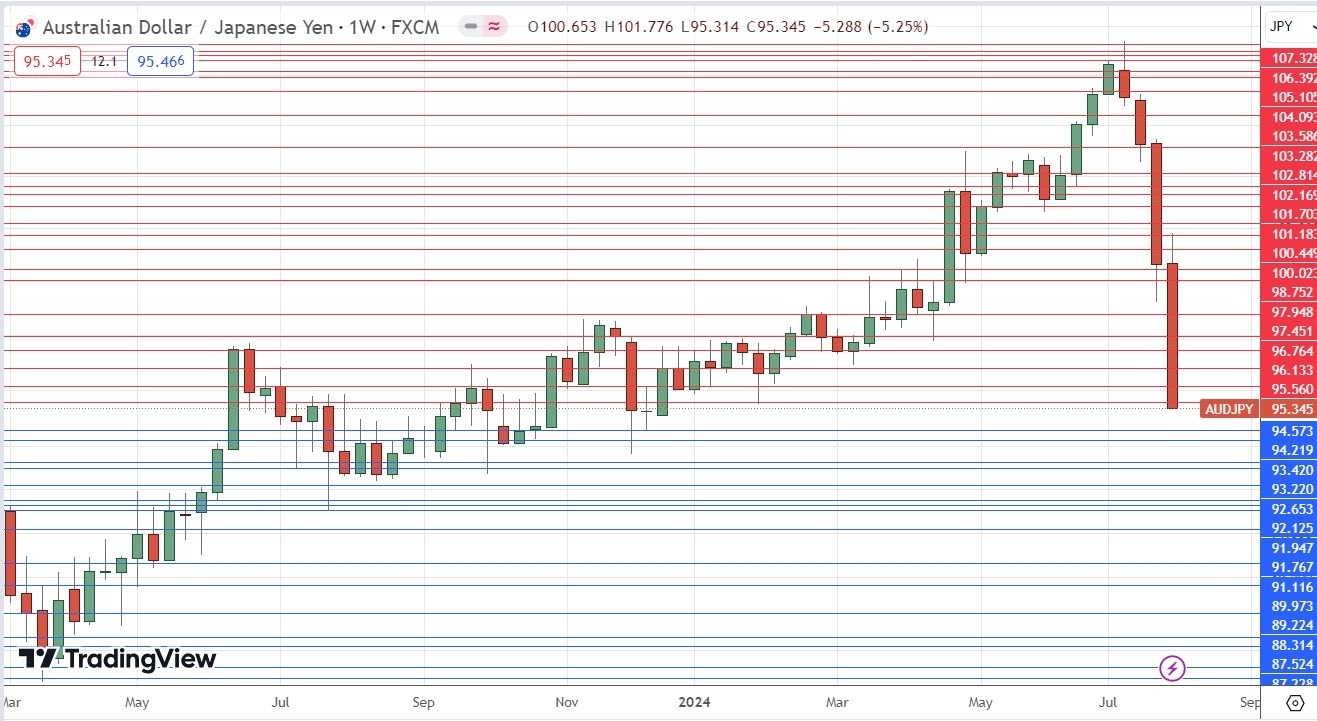
The AUD/JPY currency cross fell extremely strongly last week for the second consecutive week to close lower by more than 4%. In fact, the week’s decline was greater than 5%. This is an unusually large price movement that has not been seen for years. It was a very bearish weekly candle, with the price closing right on its low.
Although the Australian Dollar traded significantly lower last week on declining risk appetite, the Japanese Yen remains the real story. It enjoyed yet another week of dramatic strengthening but by even more than the previous week's strong advance. This was driven by the Bank of Japan’s divergent rate hike, and tighter monetary policy of halving its bond purchase program.
The Yen and Aussie are the two biggest movers in the Forex market, putting this currency cross in focus.
Technically, the drop shown in the price chart is fascinating – the move looks like a knife cutting through hot butter, as it overcomes months of grinding, advancing price action. This is a sign of fundamental change.
Although we can say that there is strong bearish momentum, I expect that with the price so oversold and trading near a cluster of key support levels, and with so many currency crosses having outsized movements last week, the price of this currency cross will advance over the coming week, at least by a little.
Therefore, I expect this currency pair's price to rise over the coming week, along with several other Yen crosses.
XAU/USD
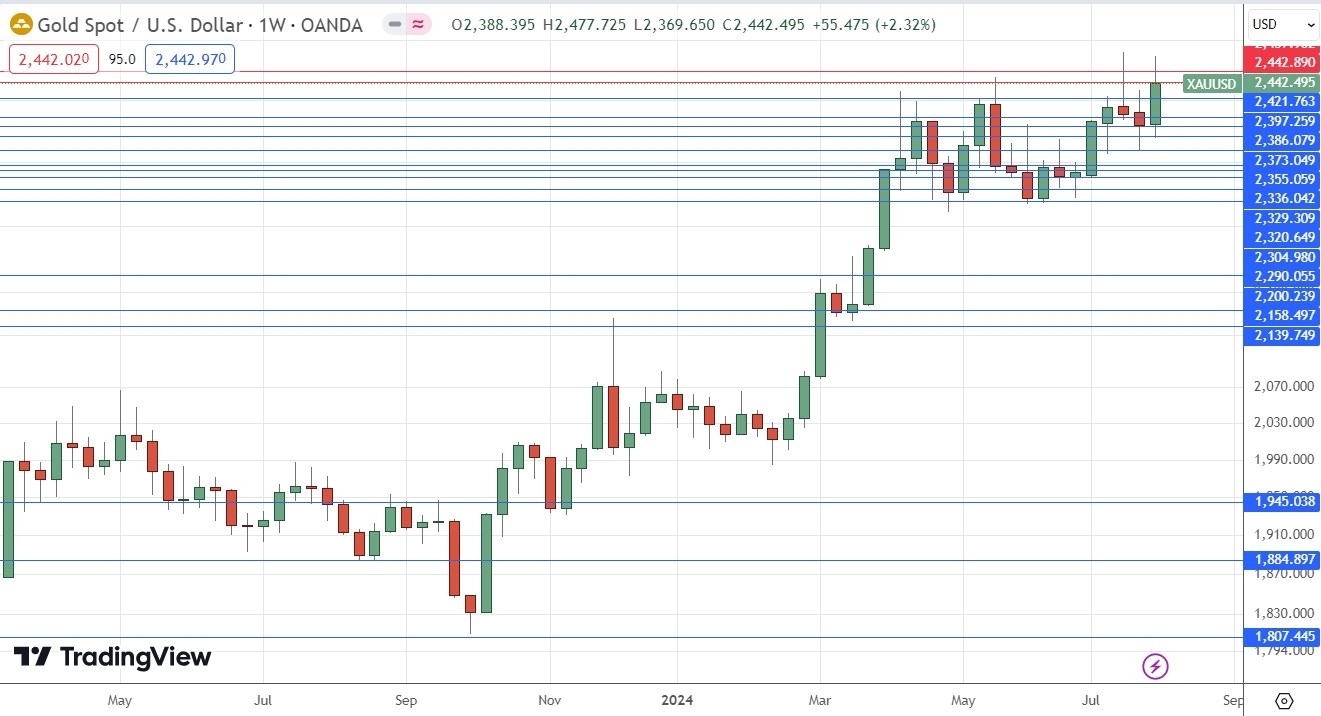
Gold rose last week to print a normally sized bullish candlestick which made the highest ever weekly close. However, it must be noted that the candlestick has a large upper wick which has rejected two key resistance levels, and the price action last week did not make a new record high.
I do not think Gold is looking bullish enough to justify a new long trade entry, but it is threatening to make a technically significant bullish breakout, so it is worth watching.
The US Dollar is looking bearish, which may help the price of Gold to advance.
Bulls will be looking for a daily close above $2,466 or, even better, the big quarter-number at $2,500.
S&P 500 Index
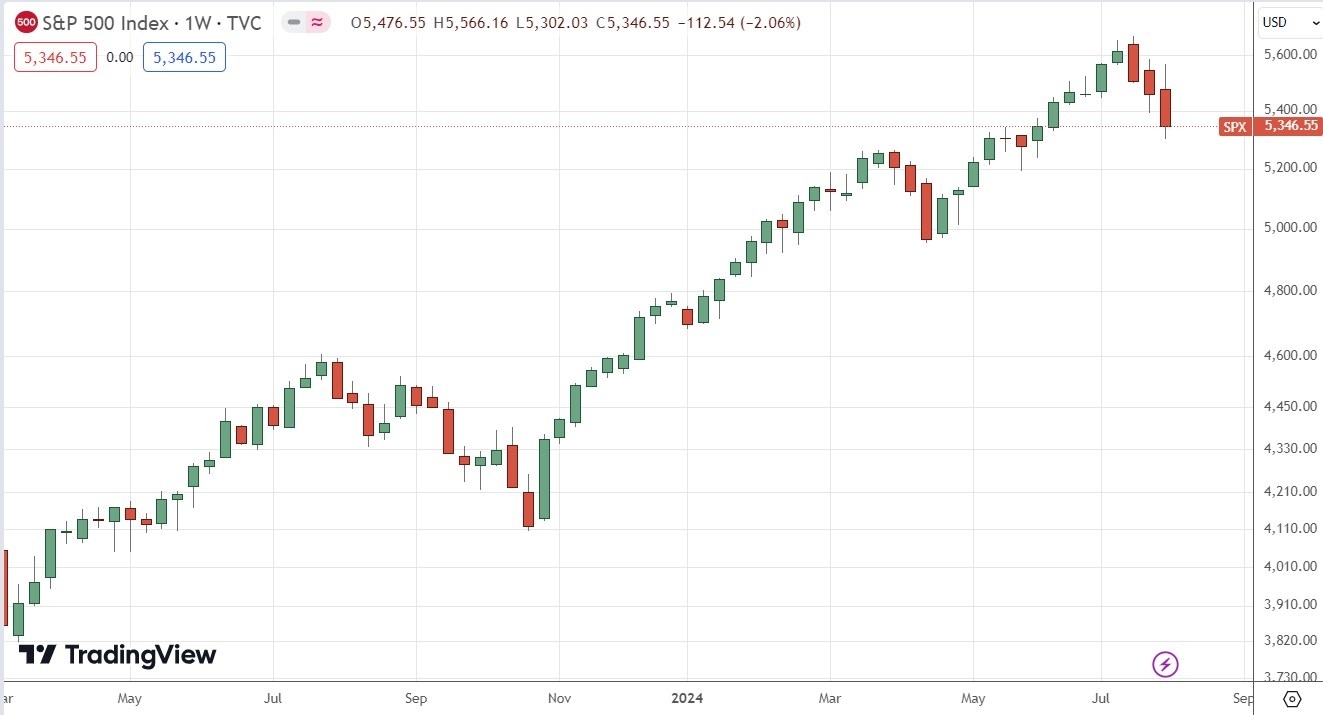
The S&P 500 Index fell again last week, after the previous two weeks when the major stock market index posted its biggest loss in months.
The move down was reasonably strong, but nothing out of the ordinary. Most trend traders won't be in a long trade here any longer despite the recent strong bullish run, as the price has retraced by more than three times the long-term daily average true range.
Technology stock indices like the NASDAQ 100 have performed even more bearishly over the past week, suggesting that the stock market has made a rotational shift. Broader market investments now look likely to outperform leading technology stocks.
Despite the recent bearishness, it cannot yet be said that the bull market is over here. The price area that stands out as most likely to be pivotal is the big quarter-number at 5,250. If we see a strong daily or weekly close below that level, we will likely be in for an even deeper retracement, and maybe also a technical end to the bull market that comes when the price is more than 20% off its peak.
2-Year US Treasury Yield
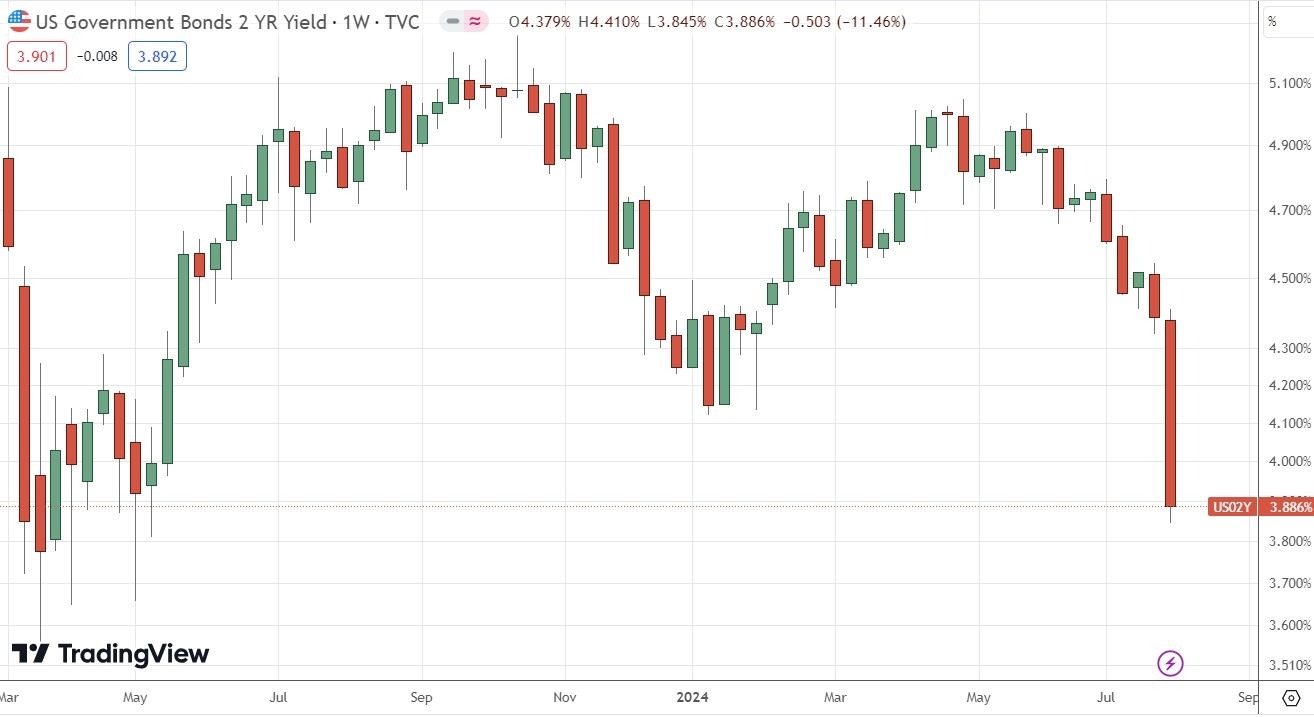
US Treasury Yields fell very dramatically and strongly last week. The weekly drop was the largest seen in over one year. Treasury yields had already been falling in recent days, but the Fed meeting which resulted in a dovish tilt really sent the yields tumbling. It is notable that both the 2-year and the 10-year yields tumbled and ended up well below 4%, suggesting a major shift in the market’s expectation towards a deeper path of rate cuts going forward.
It may be a bit too late to enter a new short trade here, however. Nevertheless, traders should remember that US Treasury Yields have an excellent record of trending reliably, the problem is whether you have access to futures and the differential of that price which can make it difficult to find a way to profit.
10-Year US Treasury Yield
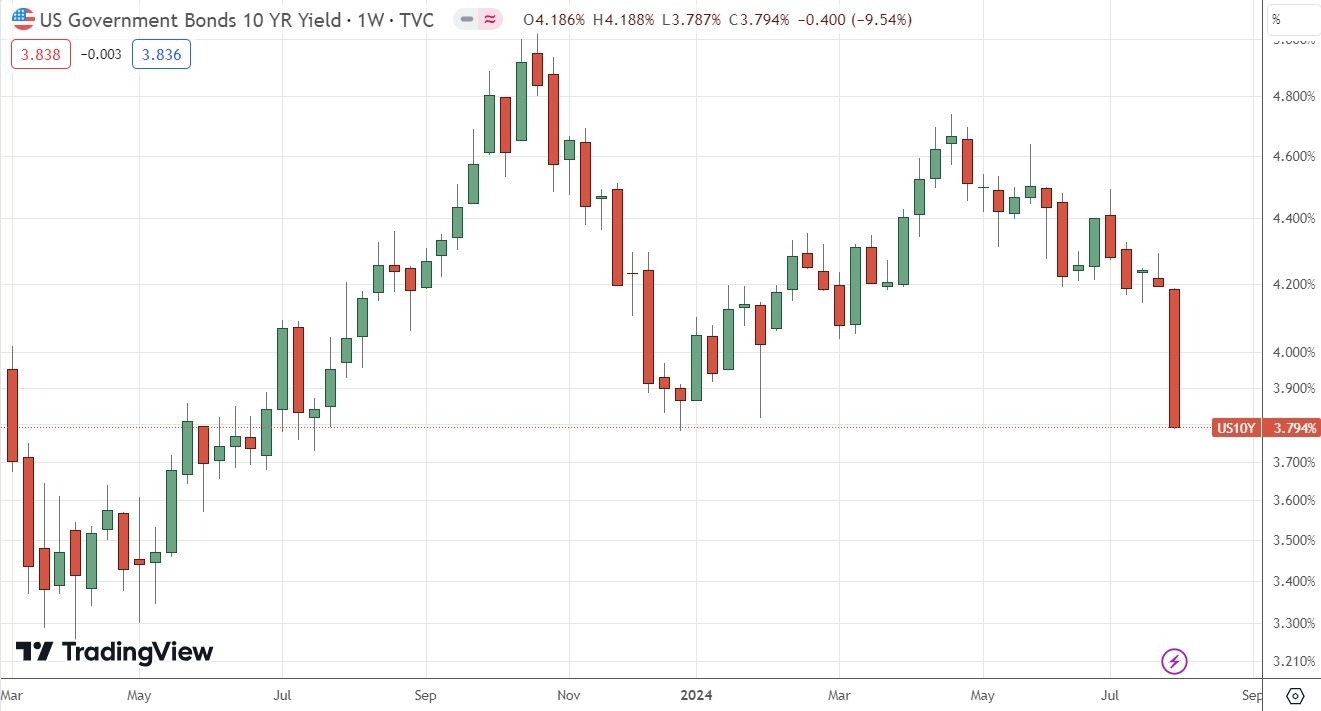
US Treasury Yields fell very dramatically and strongly last week. The weekly drop was the largest seen in years. Treasury yields had already been falling in recent days, but the Fed meeting which resulted in a dovish tilt really sent the yields tumbling. It is notable that both the 2-year and the 10-year yields tumbled and ended up well below 4%, suggesting a major shift in the market’s expectation towards a deeper path of rate cuts going forward.
It may be a bit too late to enter a new short trade here, however. Nevertheless, traders should remember that US Treasury Yields have an excellent record of trending reliably, the problem is whether you have access to futures and the differential of that price which can make it difficult to find a way to profit.
Bottom Line
I see the best trading opportunities this week as long of the following currency crosses.
- EUR/JPY
- EUR/CHF
- GBP/JPY
- CAD/JPY
- CHF/JPY
- AUD/JPY
- GBP/CHF
- NZD/JPY
- CAD/CHF
I also think a long trade in the EUR/USD currency pair could work out well.
Ready to trade our weekly Forex analysis? We’ve made a list of the top Forex brokers worth checking out.
