Bullish view
- Buy the AUD/USD pair and set a take-profit at 0.6850.
- Add a stop-loss at 0.6750.
- Timeline: 1-2 days.
Bearish view
- Set a sell-stop at 0.6785 and a take-profit at 0.6700.
- Add a stop-loss at 0.6850.
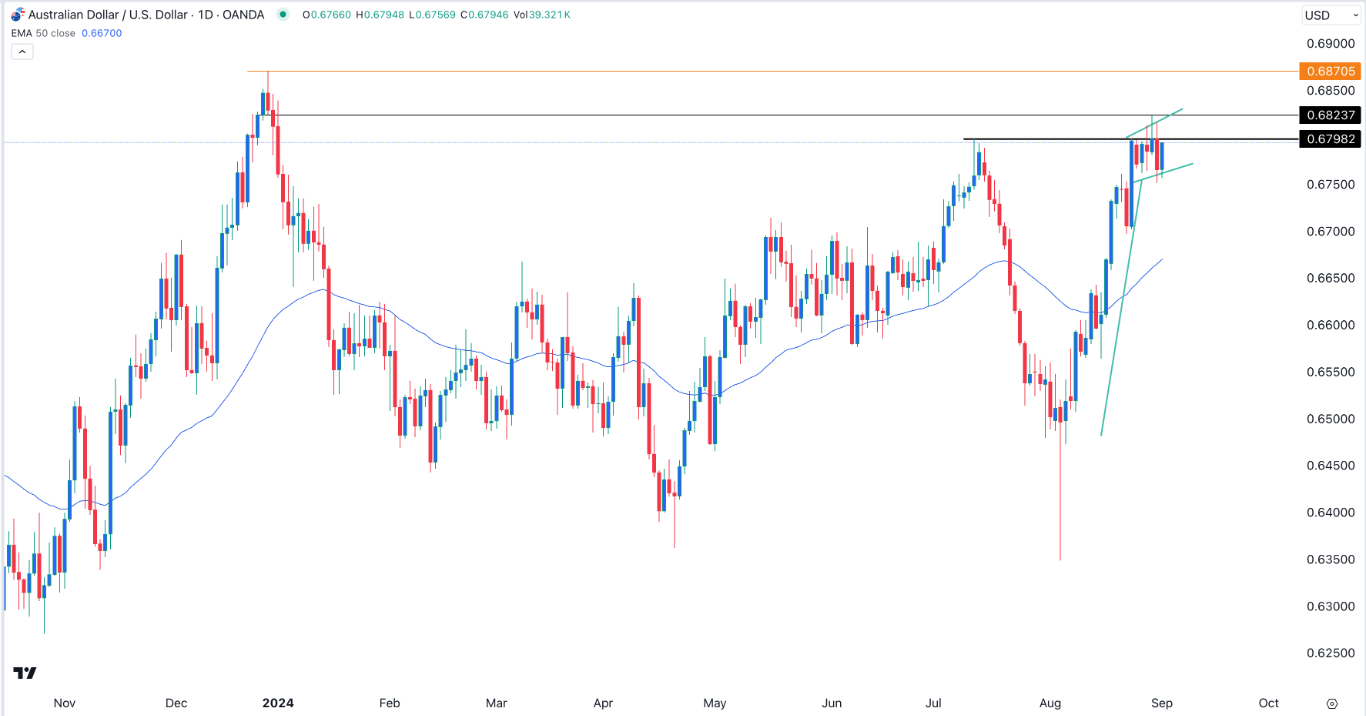
The AUD/USD exchange rate wavered at an important resistance point after the relatively mixed economic numbers from Australia and China. The pair was trading at 0.6795, a few pips below this month’s high of 0.6823.
Mixed Australian and China economic data
The AUD/USD pair held steady after Australia and China published mixed economic numbers. According to Australia’s statistics agency, business inventories dropped to 0.1% in Q2 from the previous 1.5%. Building approvals also bounced back by 10.4% after falling by 6.4% in the previous month.
However, another leading indicator showed that the economy was slowing down. According to Judo Bank and S&P Global, the manufacturing PMI increased from 47.5 in July to 48.5 in August, missing the analysts estimate of 48.7. A PMI reading of less than 50 is a sign that a sector is contracting.
Meanwhile, in China, data released on Monday revealed that the manufacturing PMI rose from 49.4 to 50.4 in August. However, a separate PMI data published on Saturday showed that the sector contracted.
Top Forex Brokers
These numbers will likely influence the Reserve Bank of Australia (RBA) when it concludes its next meeting on September 24. Most analysts believe that the bank will be the last major one to start cutting interest rates since officials deliberated on hiking rates in the last meeting.
The next important AUD/USD news will be the upcoming US ISM and S&P Global manufacturing PMI data. Analysts expect the ISM report to show that the PMI rose to 47.5 in August while the S&P will come out at 48.1.
While the PMI is an important figure, it will likely not move the pair since focus has shifted to Friday’s jobs report and this month’s Fed decision.
AUD/USD technical analysis
The AUD/USD pair has held steady at around the resistance point at 0.6798 in the past few days. This was a notable level since it was also the highest since July 11 and the upper side of the double-top pattern. It has remained above the 50-day moving average.
The pair has also formed a bullish flag chart pattern, a popular sign of a continuation. Therefore, the AUD/USD pair’s outlook is bullish as long as buyers move it above the key resistance point at 0.6823, its highest point last week. A break above that level will see it rise to 0.6870, its highest level on December 28.
Ready to trade our free Forex signals? Here are the best forex platform in Australia to choose from.


