Bearish view
- Sell the BTC/USD pair and set a take-profit at 50,000.
- Add a stop-loss at 58,000.
- Timeline: 1-2 days.
Bullish view
- Set a buy-stop at 55,000 and a take-profit at 58,000.
- Add a stop-loss at 50,000.
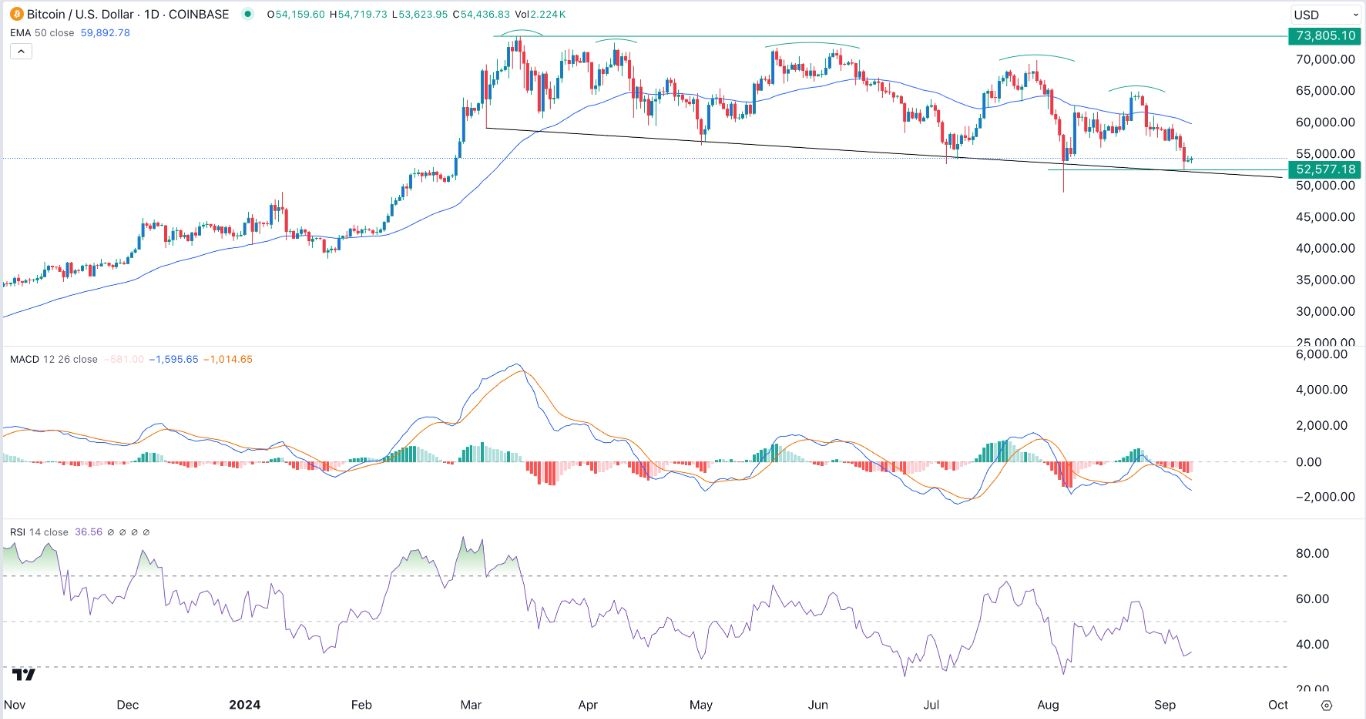
Bitcoin price continued falling as investors rotated from risky assets. The BTC/USD pair dropped to a low of 52,577, its lowest point since August 5th. It has dropped by over 30% from its highest level this year.
Bitcoin’s crash coincided with the performance in the stock market as the Dow Jones, Nasdaq 100, and the S&P 500 indices. The Dow Jones fell by 490 points while the s&p 500 and Nasdaq 100 dropped by 95 and 435 points, respectively.
At the same time, US bond yields continued falling as the yield curve disinverted. The 10-year yield dropped to 3.71% while the 30-year fell to 4.02%. Also, the 10-2 yield spread rose to 5.80%, its highest point in years.
Top Forex Brokers
The main catalyst for Bitcoin’s sell-off was the latest US jobs report, which showed that the unemployment rate slipped to 4.2%. Wage growth continued growing in August, meaning that the Federal Reserve will deliver a small cut than expected.
Bitcoin’s retreat has also happened as demand has waned recently. Data shows that Bitcoin’s futures interest dropped to the lowest point in months. Volume also continued falling in centralized exchanges.
Additional data shows that demand among institutional investors has waned. Assets in the spot Bitcoin market dropped by $169 million on Friday. It has dropped in the last seven consecutive days and stands at $16.89 billion. Spot Ethereum ETFs have also plunged by over $568 million since launch.
BTC/USD technical analysis
Bitcoin has retreated from the year-to-date high of $73,800 in March to 54,450. The BTC/USD pair has formed a series of lower lows and lower highs. It has remained below the 50-day moving average, meaning that bears are in control.
The histogram of the MACD indicator has remained below the neutral point since August 29. Also, the two lines of the MACD have continued falling.
Bitcoin has formed a bearish flag pattern, pointing to more downside. It has also remained slightly above the descending trendline, which connects the lowest point since March 5.
The BTC/USD pair’s Relative Strength Index (RSI) has moved below the neutral point. Therefore, Bitcoin will likely continue falling as sellers target the next key support at 50,000. The alternative scenario is where it rebounds and moves to the resistance point at 58,000.
Ready to trade our free Forex signals? Here are the best MT4 crypto brokers to choose from.


