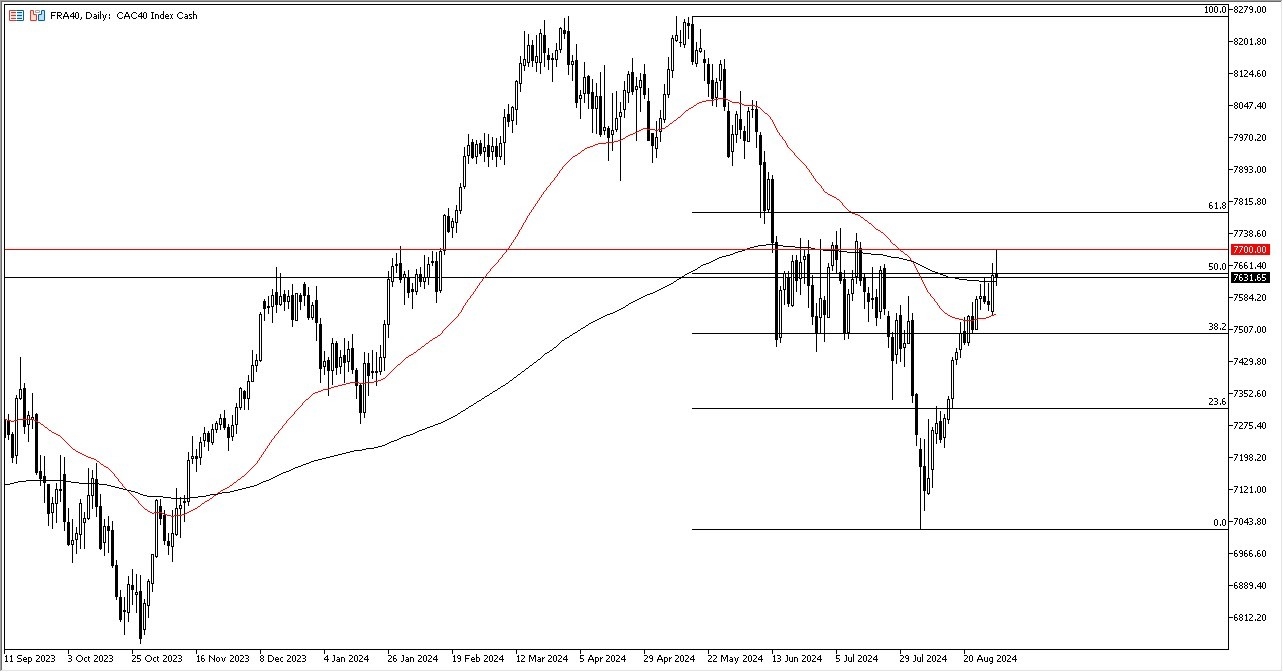
- It’s obvious to me that we are reaching a major resistance barrier, looking at the €7700 level as a major ceiling.
- All things being equal, the market also ended up forming a bit of a shooting star, so that does suggest that we are running out of momentum.
- Furthermore, we are also near the 50% Fibonacci retracement level, so that of course is worth paying close attention to it.
- Beyond that, we are also sitting on top of the 200-Day EMA, so we have a lot of things going on at the same time

Stocks Slid across the Board on Friday
Stock markets around the world all did the same thing on Friday, as the market participants were very aggressive at the start, but seemingly ran out of a lot of momentum at midday. Because of this, this is a market that looks a bit tired, and therefore I think we have a situation where we could get a bit of a pullback. In fact, I would not surprise me at all to see the CAC 40 drop to the 50-Day EMA, which of course is a major technical indicator that a lot of people will be paying close attention to. If we were to break down below there, then the next support level is the €7500 level, which obviously is very important from a psychology standpoint.
Top Forex Brokers
On the other hand, if we were to rally and break above the €7750 level, then the market could go looking to the €7800 level, perhaps even as high as €8000 given enough time. Keep in mind that the CAC is most certainly targeted more for luxury brands, so that gives us an idea as to how the rich are doing around the world. Furthermore, it is also highly sensitive to whether or not the euro is strengthening or weakening, because it can make some of these expensive items more difficult for people in North America or Asia to start buying. Ultimately, this is a market that I think continues to be sideways more than anything else, perhaps between the €7500 level underneath and the €7700 level above.
Ready to trade our daily forex forecast? Here are the best CFD stocks brokers to choose from.
