Bullish view
- Buy the GBP/USD pair and set a take-profit at 1.3250.
- Add a stop-loss at 1.3085.
- Timeline: 1-2 days.
Bearish view
- Sell the GBP/USD pair and set a take-profit at 1.3088.
- Add a stop-loss at 1.3250.
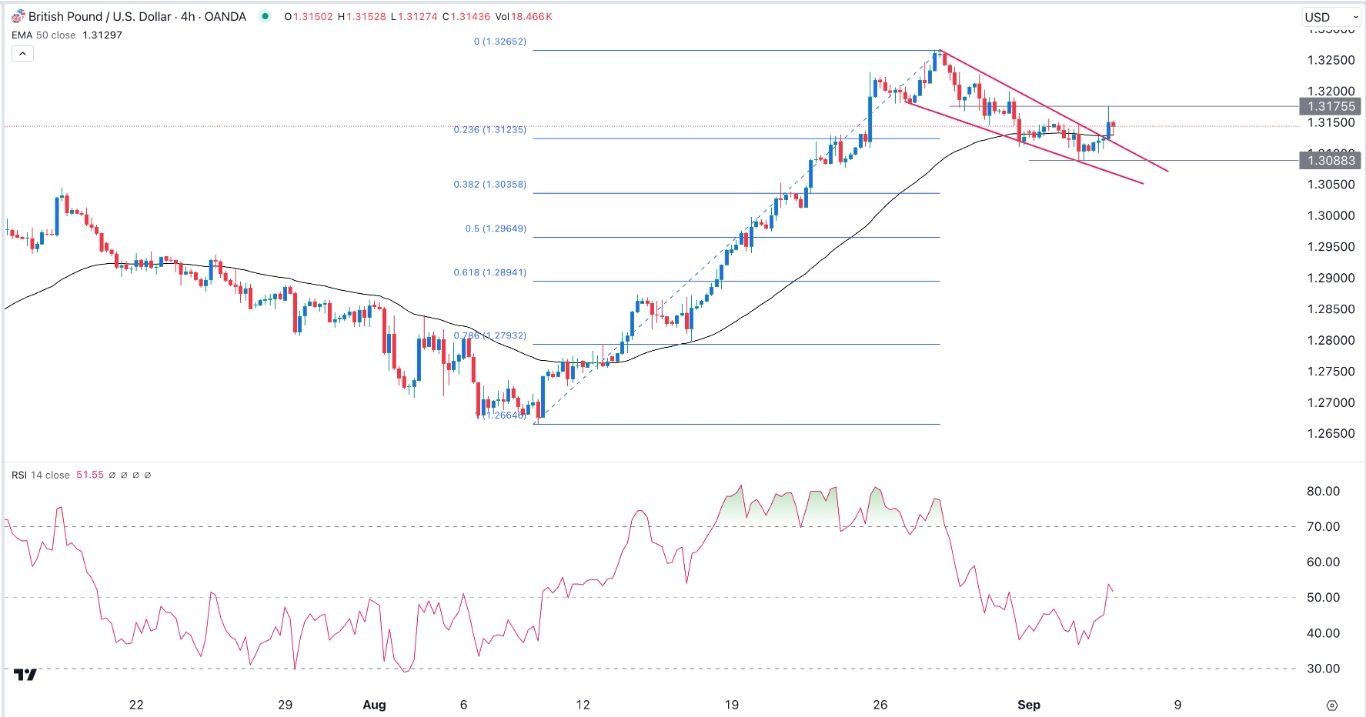
The GBP/USD pair bounced back after the JOLTs report and the Beige Book pointed to a slowing US economy. It rose to a high of 1.3175, its highest level since August 30th and much higher than last week’s low of 1.3088.
US yield curve disinverts
The GBP/USD pair bounced back after a series of weak US economic numbers showed that the economy was slowing. On Tuesday, reports by ISM and S&P Global noted that the manufacturing PMI remained below 50 in August, signaling that the slowdown continued.
A separate report by the Bureau of Labor Statistics (BLS) showed that the number of job vacancies continued falling in July. It retreated from over 7.91 million in June to 7.63 million in July, missing the expected increase of 8.09 million.
Top Forex Brokers
The weak jobs and manufacturing PMI data led to a sharp retreat of the greenback, with the US dollar falling by 0.50% to $101.27. It also led to the disinversion of the yield curve for the second time since 2022.
The yield curve is said to be inverted when short-term government bonds are offering higher yields than short-term ones. The 10-year was trading at 3.76% on Thursday morning while the 5-year was at 3.57%.
This performance happened as investors continued pricing in interest rate cuts by the Federal Reserve in its next meeting later this month. The Fed has already hinted that this cut is coming. What is unclear is the size of the cut, with most analysts expecting a 0.25% cut.
However, some analysts expect the cut to be 0.50%, especially if Friday’s non-farm payrolls (NFP) report comes out short of expectation.
The key GBP/USD news to watch on Thursday will be the upcoming US services PMIs, ADP jobs report, and the initial jobless claims numbers.
GBP/USD technical analysis
The GBP/USD exchange rate peaked at 1.3265 last week as the US dollar sell-off continued. It then retreated and bottomed at 1.3088, a few points below the 23.6% Fibonacci Retracement point.
As it dropped, the pair formed a falling wedge chart pattern, a popular bullish sign. It has also moved slightly above the 50-period Exponential Moving Average (EMA) while the Relative Strength Index (RSI) moved above the neutral point of 50.
Therefore, because of the falling wedge, the pair will likely continue rising as bulls target the key resistance point at 1.3250.
Ready to trade our free daily Forex trading signals? We’ve shortlisted the best UK forex brokers in the industry for you.


