GBP/USD
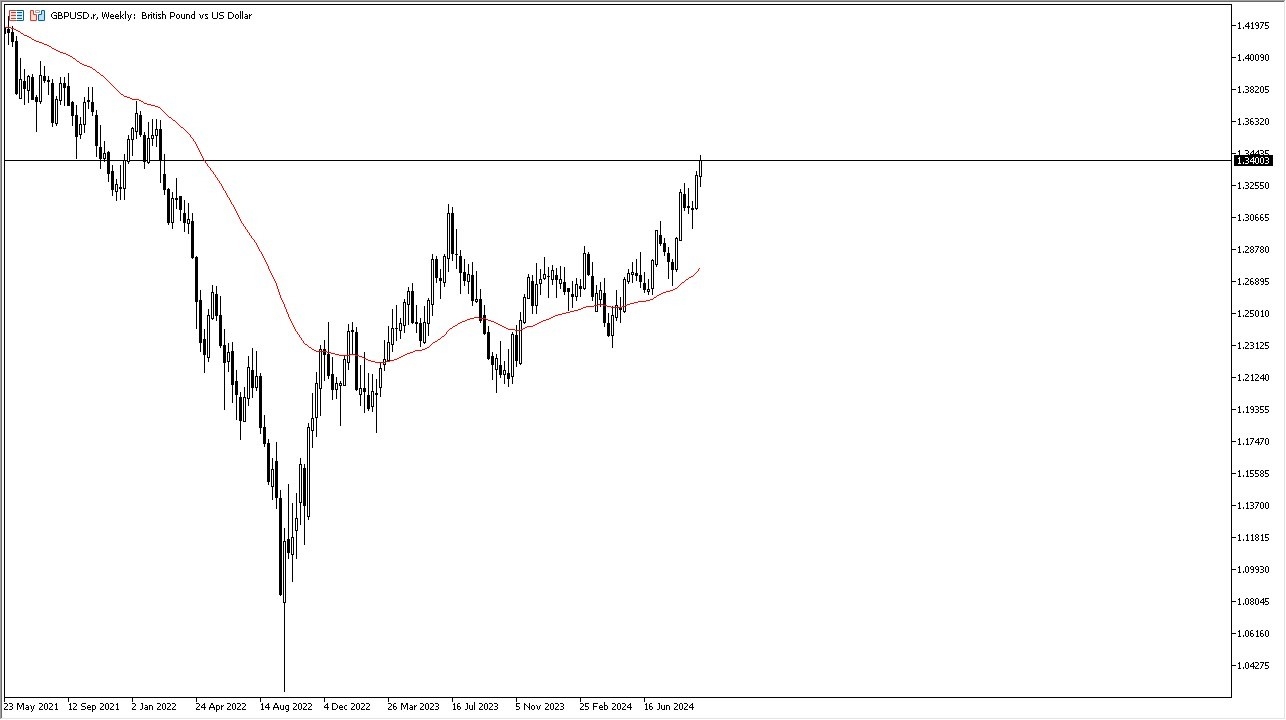
The British pound has rallied during the course of the week, as we had initially pulled back, only to turn around a break above the 1.34 level during the middle of the day on Friday. Ultimately, the GBP/USD market is a one that continues to see a lot of bullish behavior, and therefore I think it will remain a market that dips will continue to attract a certain amount of attention. With this, I do believe that the 1.3250 level should offer a short-term or in the market for traders looking to take advantage of “cheap British pounds.”
USD/CHF
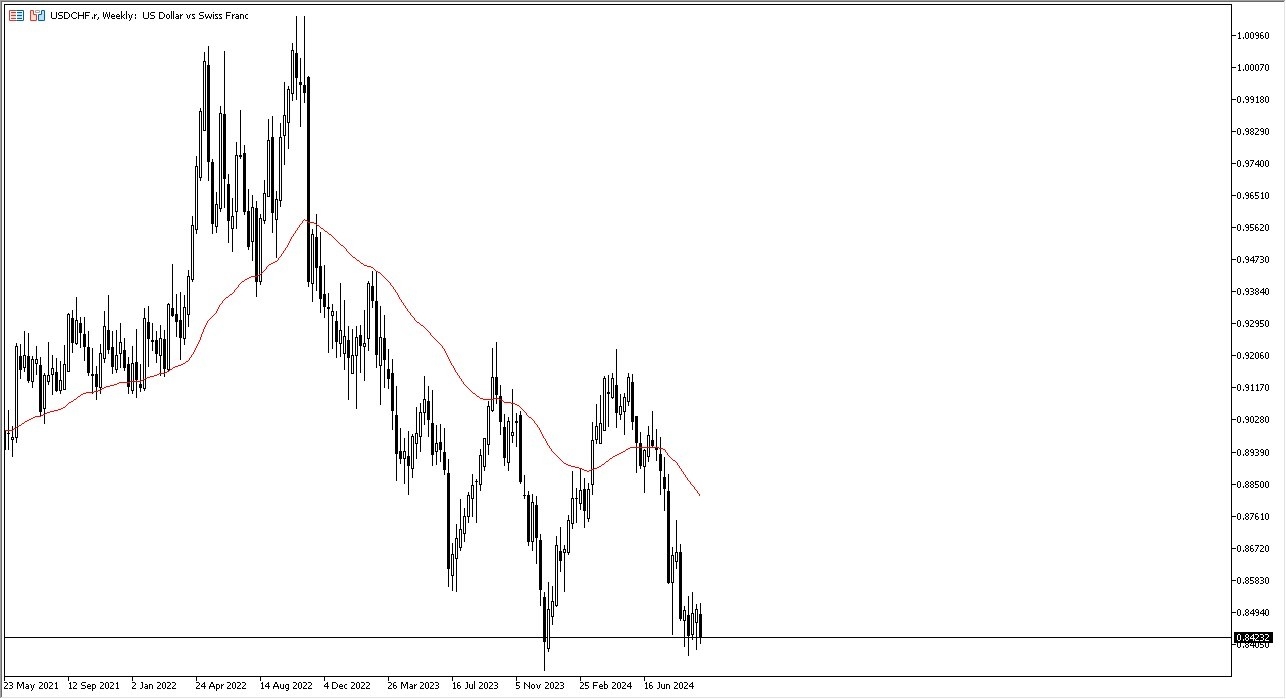
The US dollar has had a tough week against the Swiss franc, and quite frankly most other currencies. That being said, the market is more likely than not to continue to be very noisy, and I do believe that it is worth watching the area around the 0.84 level, which has been a major support level in this market more than once. I think extends down to the 0.8350 level, so the fact that we are closing the market at these extraordinarily low levels does suggest that we have a fight on our hands. Ultimately, I’ll be watching to see if the market can turn things around and break above the 0.86 level, because if it did this could end up being an excellent buying opportunity.
Top Forex Brokers
USD/CAD
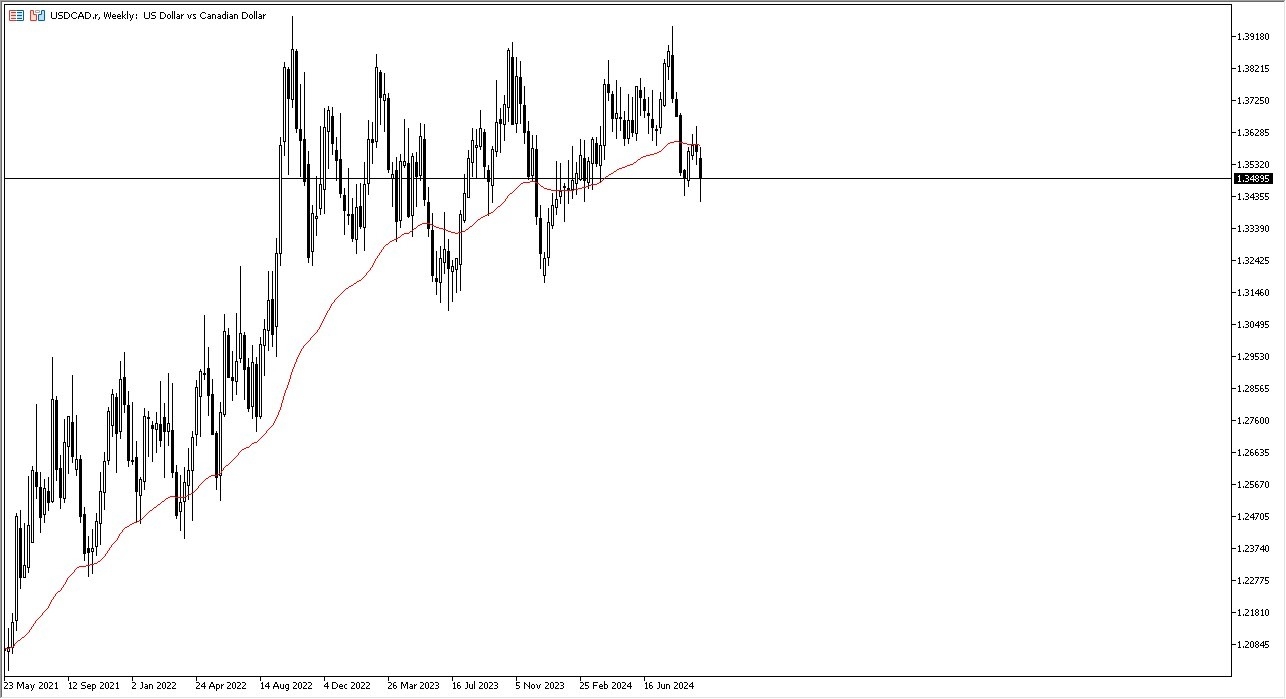
The US dollar has fallen significantly against the Canadian dollar (USD/CAD currency pair) during the course of the week, but that should not be a huge surprise considering the US dollar has lost ground against most currencies. The Canadian dollar is strengthening has everything to do with the Federal Reserve cutting interest rates by 50 basis points during the previous week, and almost nothing to do with oil, which of course has been collapsing. At this point in time, the 1.34 level continues to be a major support level.
NZD/USD
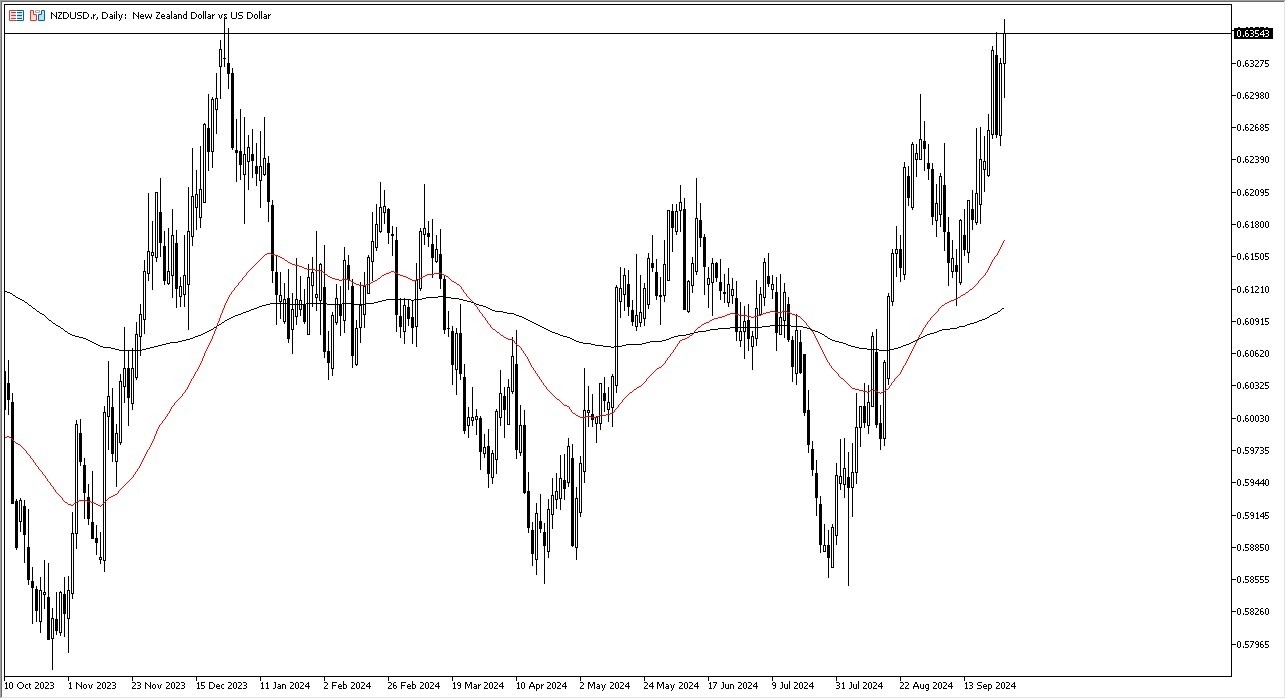
The New Zealand dollar has initially fallen during the past week, but only to turn around and show signs of strength. The 0.6350 level has been an area of significant resistance previously, and at this point I think it’s probably only a matter of time before this market rallies rather significantly. Short-term pullbacks at this point in time will end up being a potential buying opportunities, unless we end up dropping down below the 0.6235 level, which I think could be a sign of further trouble. Keep in mind that the NZD/USD market is highly sensitive to risk appetite and rises and falls with overall global risk appetite attitudes.
S&P 500
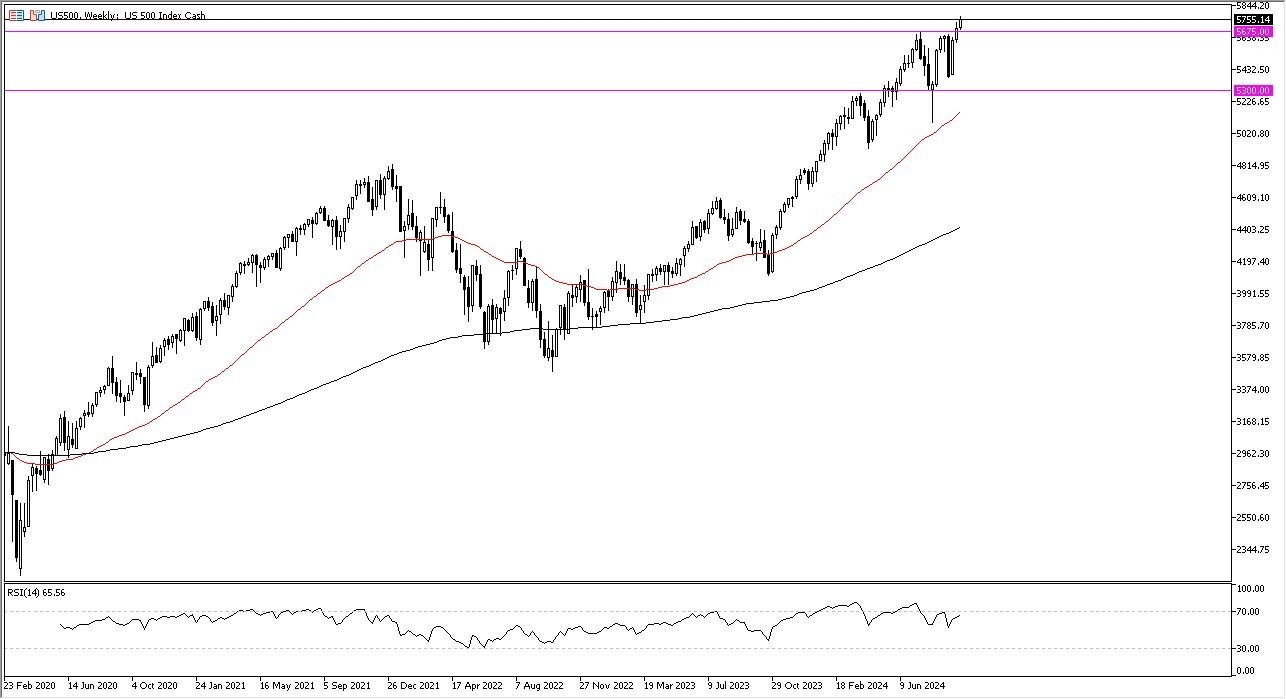
The S&P 500 had another bullish week, as we have now broken out to the upside, and it looks like we are going to continue to go higher. Short-term pullbacks should be buying opportunities, as the 5675 level should have a bit of “market memory” attached to it, so I think short-term pullbacks will continue to face a significant amount of support. Even if we were to break down below that level, it’s not until we break down below the 5300 level that I would start to question the overall uptrend. To the upside, the 6000 level could be a potential target, but it will take some time to get there as we will more likely than not grind higher.
USD/MXN
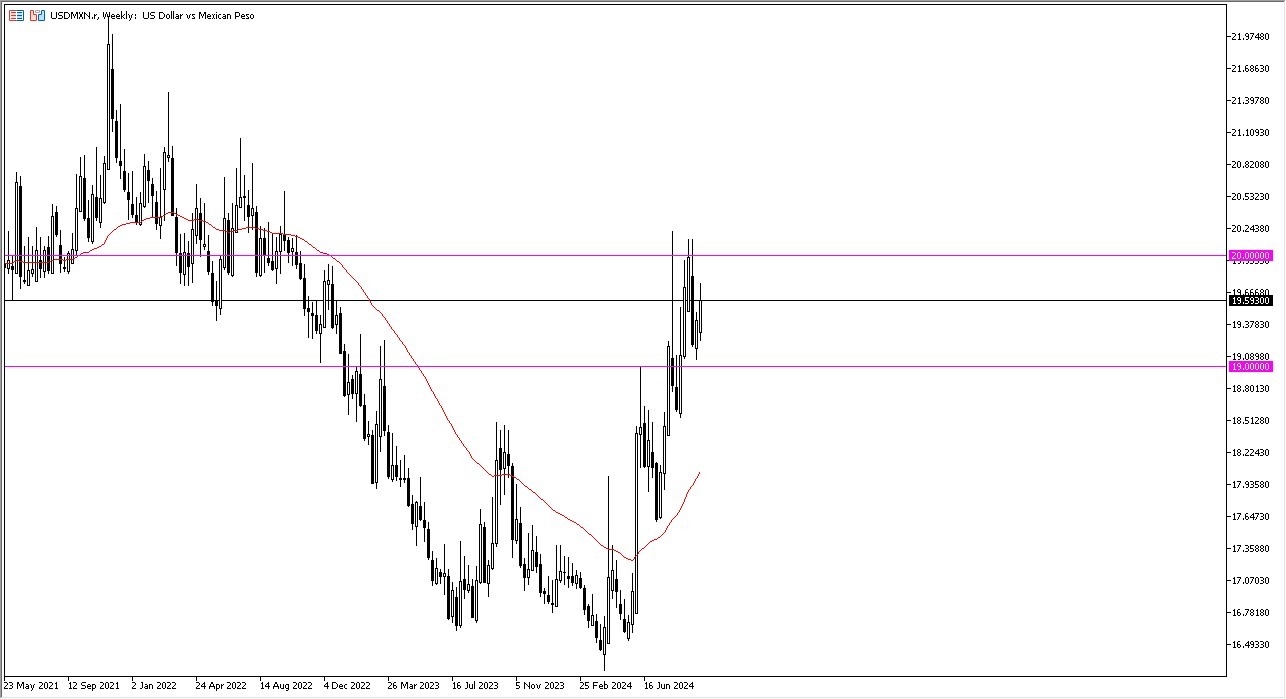
The US dollar has rallied significantly during the course of the trading week against the Mexican peso, which might be a little bit counterintuitive to those of you who are not used to trading the USD/MXN currency pair, but it’s actually a sign of “risk off behavior.” All things being equal, if the US economy is slowing down, it’s the same thing as the Mexicans losing their biggest customer. We have been bouncing around between 19 MXN and 20 MXN, and I think that continues to be the case, but it certainly seems to favor the upside. If we get a weekly close above the 20 MXN level, we could see the Mexican peso get absolutely hammered.
Gold
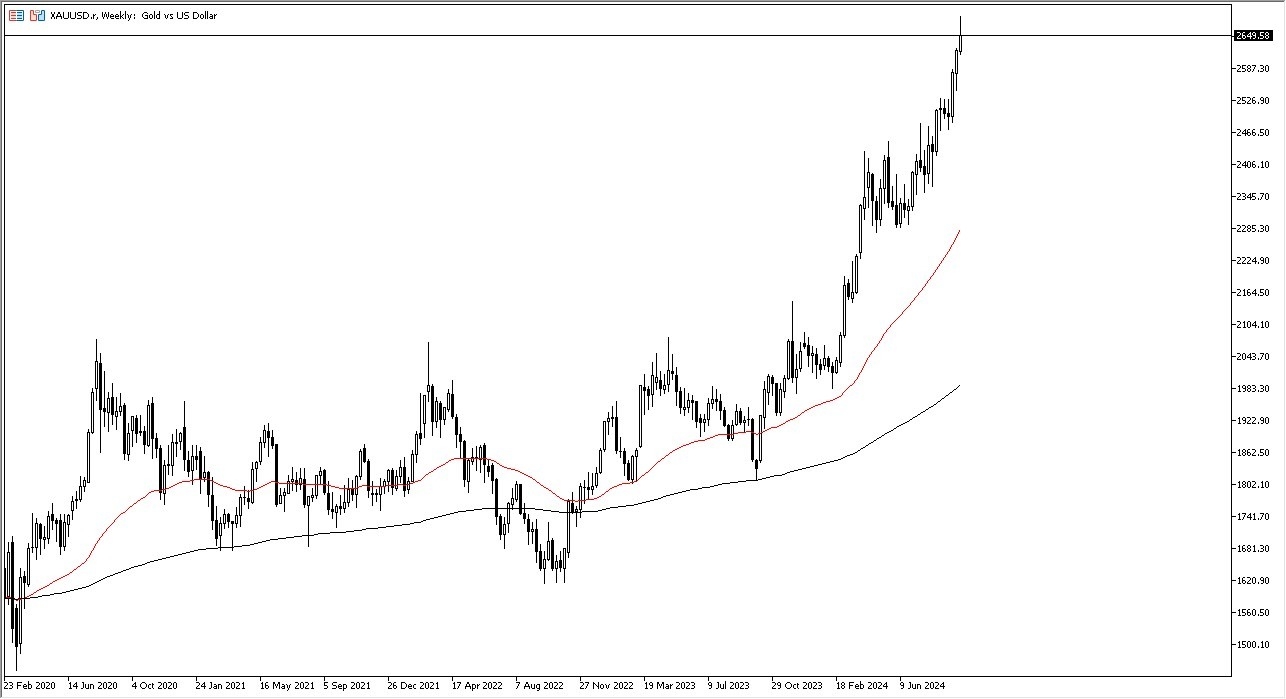
Gold markets have shot higher during the course of the week, but they also have seen quite a bit of profit-taking on Friday. All things being equal, this is a market that I think you continue to buy on short-term pullbacks, but we are clearly overstretched in this market. I think at this point in time, we need a week or 2 of somewhat negative behavior, before it starts to offer value the people are willing to take advantage of. From a longer-term fundamental standpoint, I have no interest in selling this market short, and therefore I think you’ve got the look at this through the prism of looking for value.
WTI Crude Oil
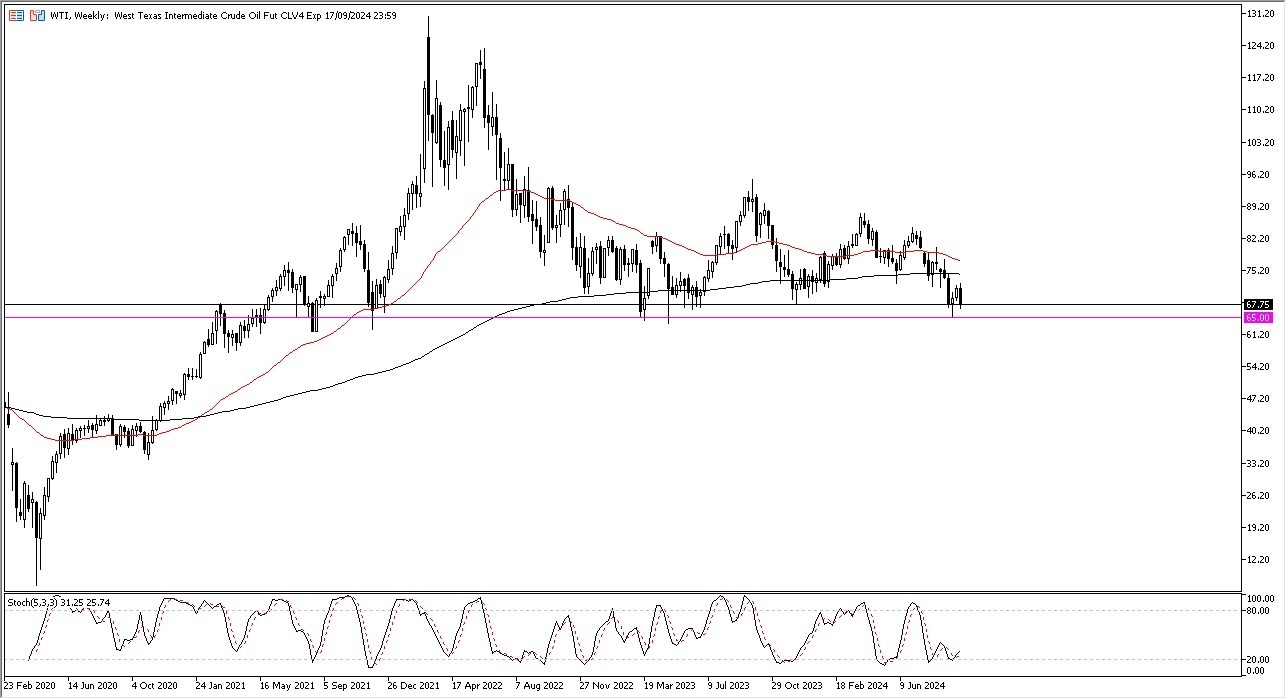
The West Texas Intermediate Crude Oil market has seen quite a bit of downward pressure over the course of the week, as it looks like we have plenty of buyers underneath. The $65 level should continue to be a significant support level, and as long as we can stay above there it’s likely that the crude oil markets will have some life. However, it’s also worth noting that a lot of traders out there are concerned about the overall growth outlook, and therefore there is a bit of a sour taste for those willing to get long. In general, I think we continue to see a lot of noisy behavior as we bump along the bottom of the range for the last couple of years.
Ready to trade our Forex weekly forecast? We’ve made a list of some of the best regulated forex brokers to choose from.
