Fundamental Analysis & Market Sentiment
I wrote on 22nd September that the best trade opportunities for the week were likely to be:
- Long of Gold in USD terms. This produced a win of 1.42%.
- Long of the S&P 500 Index. This produced a win of 0.46%.
- Short of the 2-Year US Treasury Yield following a daily close below 3.55%. This set up at Tuesday’s close but gave a loss by the end of the week of 0.59%.
Overall, these trade opportunities produced a win of 1.29%, averaging 0.43% per asset.
Top Forex Brokers
Last week’s key takeaways were:
- Friday’s US Core PCI Price Index data, the key inflation metric watched by the Federal Reserve, rose by less than expected, showing a month-on-month increase of only 0.1% against the forecasted 0.2%. This helped boost risk assets on the day, especially stock markets, but much of the initial gains were given up when news began to emerge later in the day that Israel had likely eliminated the leader of Hezbollah, in addition to the remaining top leadership and a high-ranking Iranian general as well, in a dramatic airstrike in Beirut using bunker-buster bombs. This raises the prospect of a regional war in the Middle East, and as such this could be a drag on risk sentiment as the new week gets underway.
- US Final GDP data came in as expected, at an annualized rate of 3.0%.
- US CB Consumer Confidence was much lower than expected, in fact it was at its lowest level for years. This was dovish for the US Dollar and the Fed’s monetary policy.
- US Germany UK France Flash Manufacturing & Services PMI all came in lower than expected, suggesting a general weakening of the US, German, British, and French economies.
- RBA Cash Rate & Rate Statement – the RBA left its Cash Rate at 1.35% as expected but also stated that no cuts were expected over the near term, which helped strengthen the Australian Dollar.
- Australian CPI (inflation) – this came in exactly as expected at an annualized rate of 2.7%.
- SNB Policy Rate and Monetary Policy Assessment – as widely anticipated, the SNB cut their interest rate from 1.25% to 1.00%.
- US Unemployment Claims – this came in slightly lower than expected.
- Canadian GDP – this was a little better than most analysts had forecasted, showing a month-on-month growth of 0.2%.
The Week Ahead: 30th September – 4th October
The coming week’s schedule is even lighter than last week, but notably includes US non-farm payrolls and several items of non-US inflation data:
- US Non-Farm Payrolls and Average Hourly Earnings
- German Preliminary CPI (inflation)
- Eurozone CPI (inflation) Flash Estimate
- Swiss CPI (inflation)
- US JOLTS Job Openings
- US ISM Services PMI
- US ISM Manufacturing PMI
- US Unemployment Claims
It is a public holiday in China from Tuesday to Friday, in Canada on Monday, and in Germany on Thursday.
Monthly Forecast October 2024

For the month of October, I forecast that the EUR/USD currency pair will rise in value.
I forecasted that the EUR/USD currency pair would rise in value during September. The performance of my forecast so far is as follows:

Weekly Forecast 29th September 2024
Last week, I made no weekly forecast, although I did note that it was probably technically likely that the Japanese Yen would make some gain over the coming week after being sold off so strongly during the previous week, and this proved to be correct.
This week, I again do not give a weekly forecast.
Directional volatility in the Forex market fell a little last week—37% of the most important currency pairs and crosses fluctuated by more than 1%. The Japanese Yen remains the most volatile major currency.
Last week, the Japanese Yen was the strongest major currency, while the Euro was the weakest.
You can trade these forecasts in a real or demo Forex brokerage account.
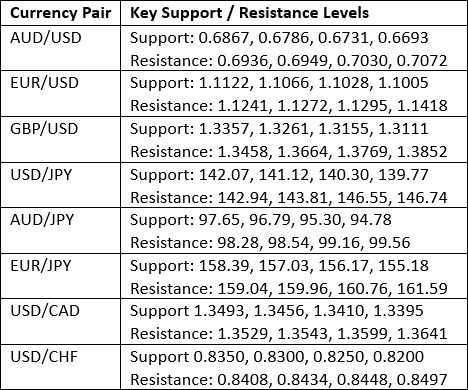
Key Support/Resistance Levels for Popular Pairs
Technical Analysis
US Dollar Index
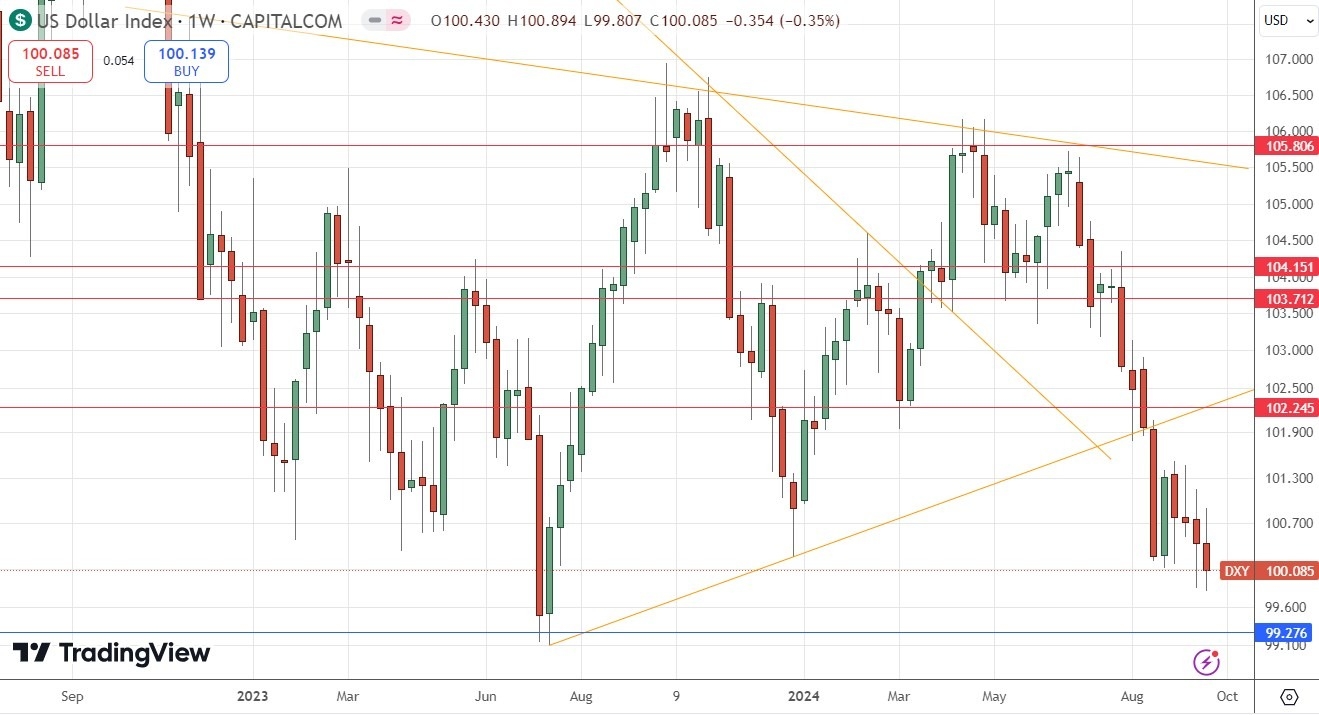
Last week, the US Dollar Index printed a bearish candlestick, with the price closing well within its lower half after briefly trading at a new 1year low. The price is below its levels from three and six months ago, suggesting a long-term bearish trend in the greenback, which is a bearish indication.
The overall picture is bearish. However, bears should be aware that It is possible that if the long-term low at the support level shown in the price chart is reached, we could see a strong bullish reversal from that area.
This coming week, I am bearish on the US Dollar due to the bearish trend and price action.
GBP/USD
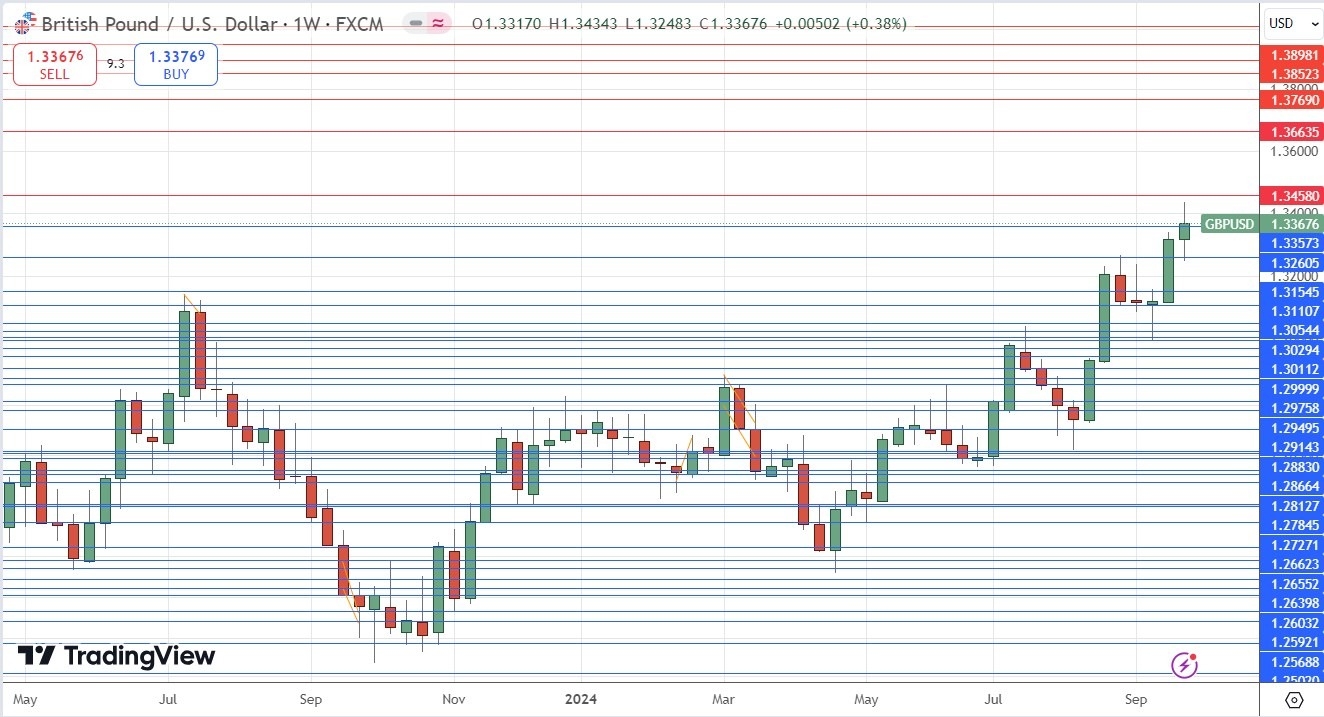
The GBP/USD currency pair rose again last week to reach a new 2.5-year high price above $1.3400 before giving up much of its gains. The weekly price chart below shows it is in a long-term bullish trend and is one of the strongest major currencies. However, the large upper wick should make bulls somewhat cautious, as should the “railroad track” pattern showing on the daily chart. This currency pair tends to be traded best on breakouts to new highs rather than pullbacks. However, there was a great opportunity to enter long early in one of last week’s London sessions from the bullish bounce at the support level at $1.3261.
With the US Dollar in a bearish trend, I see this currency pair as a buy, but only after we get a new daily (New York) close above $1.3458.
USD/JPY
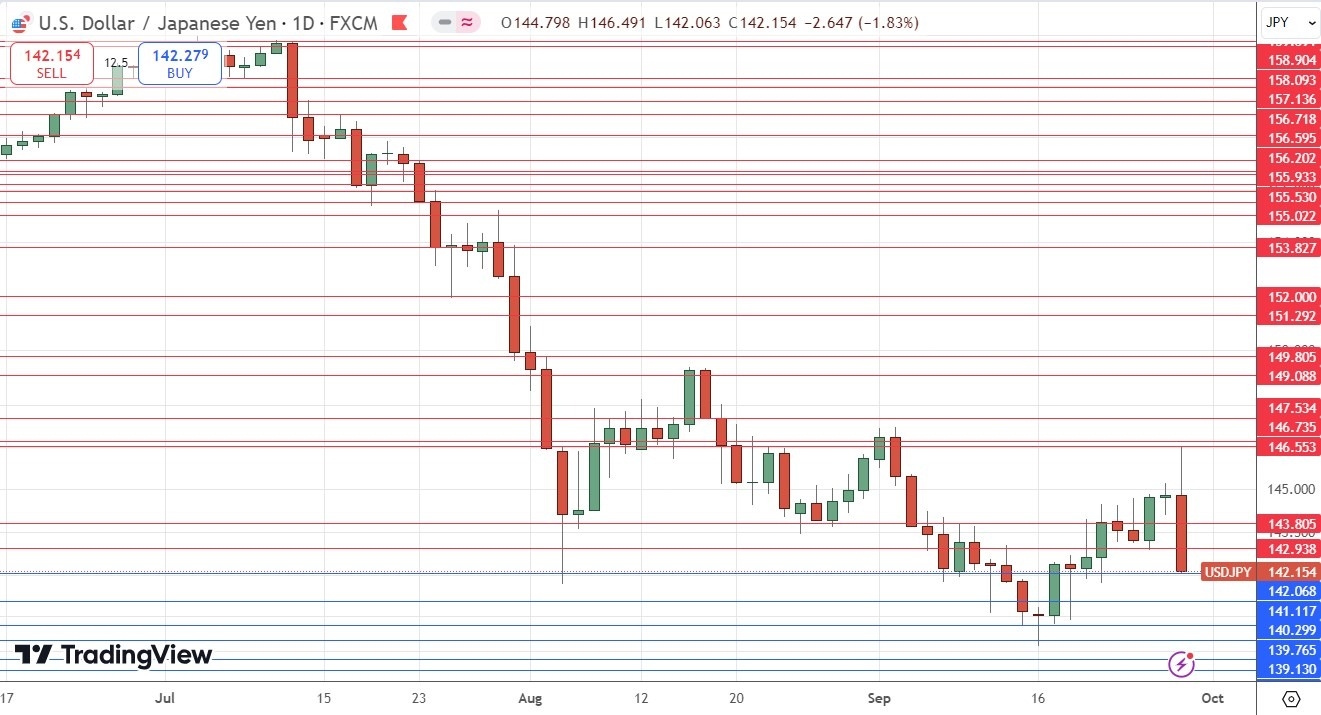
The USD/JPY currency pair made a massive bearish turnaround on Friday, falling extremely sharply after rising to trade above ¥146 near a new monthly high price. The price fell by more than 400 pips and closed near its low, which is a bearish sign. However, as the price had risen over the earlier part of the week, the weekly candlestick does not look as dramatic as the daily one, which engulfed the previous four days.
The dramatic surge in the Yen was obviously due to the confirmation of Shigeru Ishiba as Japan’s next Prime Minister. Mr. Ishiba is a hawk on interest rates, so we can expect that the Bank of Japan will now probably raise rates more quickly over the coming months. It is already on a path of rate increases.
It is an open question whether the price will continue to fall as markets open this week, but it should be noted that most trend-following hedge funds will still be short here, and that the Yen’s place as a haven currency could resume, with risk sentiment potentially deteriorating if the Middle East heads toward regional war.
XAU/USD
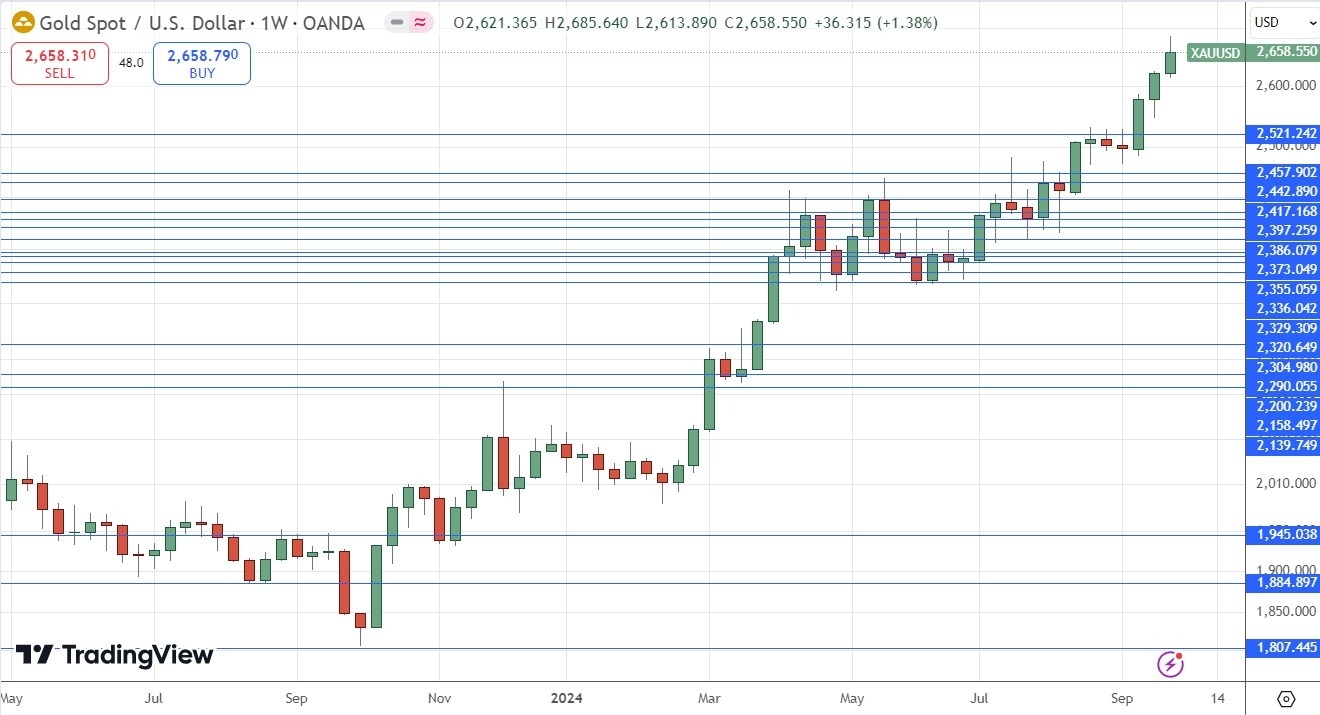
Last week, I wrote that Gold was a buy without any doubt, as it was advancing strongly into blue sky, making new record high prices. This was a good call, as the price rose even further over the past week. Although the price closed within the upper half of its range, it should be noted that there is a significant upper wick, which may be a reason to have some caution towards a bullish approach.
Despite Gold’s reputation as a risk hedge, historically the price of Gold has tended to be positively correlated with major stock market indices. Therefore, whether the price of Gold rises further over the short term may well depend on risk sentiment. If the Middle East moves toward a regional war over the coming days, the price will likely fall.
I see Gold as a buy, but only following a daily close at a new record high price.
S&P 500 Index
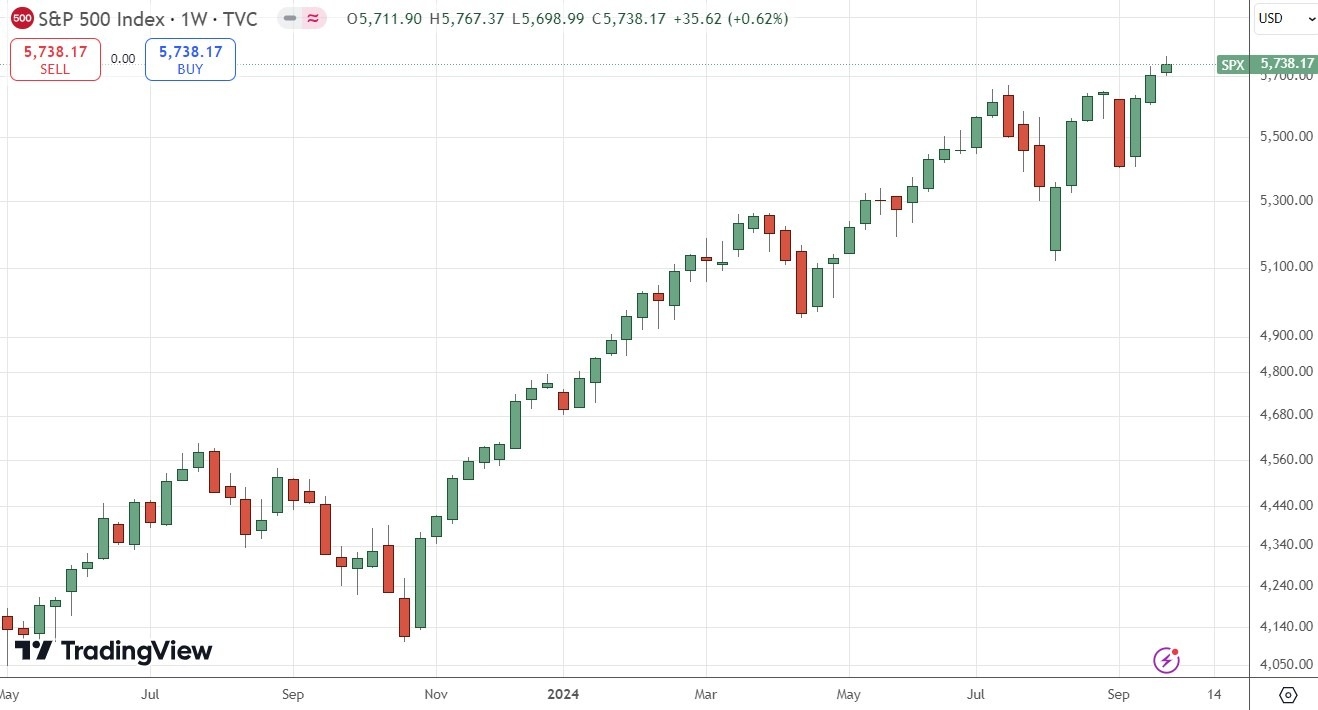
Following the previous week’s breakout to a new record high after a period of retracement and consolidation, the S&P 500 Index followed by a consolidation, but at the end of last week, we finally got a breakout to a new record high. Fresh breakouts to record highs tend more often than not to produce periods of extended gains, which is a bullish sign.
Despite that, it is notable that last week’s candlestick was very small, which suggests a lack of bullish momentum. It is possible that the price will fall back, especially if geopolitical factors trigger a deterioration in risk sentiment over the coming days.
Due to the risk, while respecting the bullish technical position, I would be prepared to enter a new long trade here if we get a fresh daily close above 5,768 on a relatively large daily range, i.e. a bullish candlestick of good size without much upper wick.
Bottom Line
I see the best trading opportunities this week as:
- Long of the GBP/USD currency pair following a daily close above $1.3458.
- Long of Gold in USD terms following a daily close above $2,685.
- Long of the S&P 500 Index following a daily close above 5,768 on a relatively large bullish candlestick with little upper wick.
Ready to trade our Forex weekly forecast? Check out our Forex brokers list.
