Bullish view
- Buy the BTC/USD pair and set a take-profit at 64,500.
- Add a stop-loss at 59,000.
- Timeline: 1-2 days.
Bearish view
- Sell the BTC/USD pair and set a take-profit at 59,000.
- Add a stop-loss at 64,000.
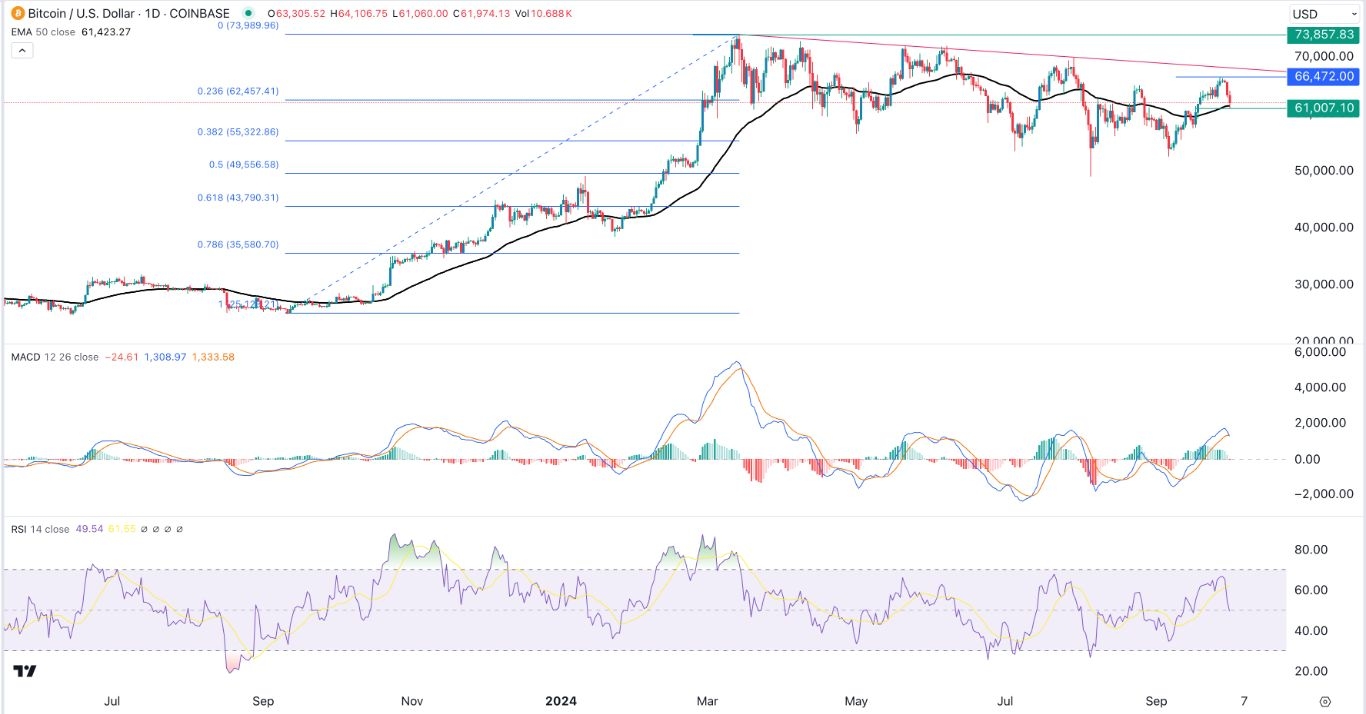
Bitcoin and other risky assets retreated sharply in the overnight session amid rising geopolitical risks in the Middle East. The BTC/USD currency pair dropped to the important support level at 61,000, its lowest point since September 18 and 8.25% below its highest point last week.
Geopolitical risks
The BTC/USD pair retreated as the US dollar index (DXY) rebounded following Iran’s decision to launch hundreds of ballistic missiles to Israel in response to the killing of the head of the Hezbollah.
The missile attacks came a day after Israel launched a limited ground offensive in Lebanon, where it is fighting with Hezbollah.
As a result, there is a risk that the region will see a prolonged war in the near term. A regional war would have major implications, especially on inflation because of higher oil prices. Brent and the West Texas Intermediate (WTI) rose to $73.5 and $70, respectively.
Top Forex Brokers
Bitcoin retreated as the US dollar index (DXY) rose by 0.50% to $101 while gold jumped to a record high of $2,700. In most periods, gold is often seen as a better safe haven when there are major geopolitical risks.
Bitcoin also retreated as other risky assets like stocks dropped. The main stock indices in the US like the Nasdaq 100 and the Dow Jones retreated by over 1% before paring back some of the losses.
The next important catalyst for the BTC/USD pair will be the upcoming US jobs numbers by ADP, the biggest payroll company in the US. Economists expect the report to show that the private sector created 124k jobs in September, from 99k in the previous month.
These numbers will come ahead of the official US nonfarm payrolls (NFP) data, which will provide more clues on the next Fed action.
BTC/USD technical analysis
The BTC/USD pair retreated from this week’s high of 66,472 to a low of 61,000 as geopolitical risks rose. It retested the important support at the 50-day Exponential Moving Average (EMA) and moved slightly below the 23.6% Fibonacci Retracement point.
The two lines of the MACD indicator formed a bearish crossover pattern while the Relative Strength Index (RSI) has pointed downwards.
Therefore, Bitcoin will likely remain in this range on Wednesday as traders wait for the next catalyst. The key resistance and support levels to watch will be at 66,472, its highest point on Sunday and 59,000.
Ready to trade our daily signals? Here’s a list of some of the best crypto brokers to check out.


