Bearish view
- Sell the BTC/USD pair and set a take-profit at 60,000.
- Add a stop-loss at 66,500.
- Timeline: 1-2 days.
Bullish view
- Set a buy-stop at 64,000 and a take-profit at 66,500.
- Add a stop-loss at 60,000.

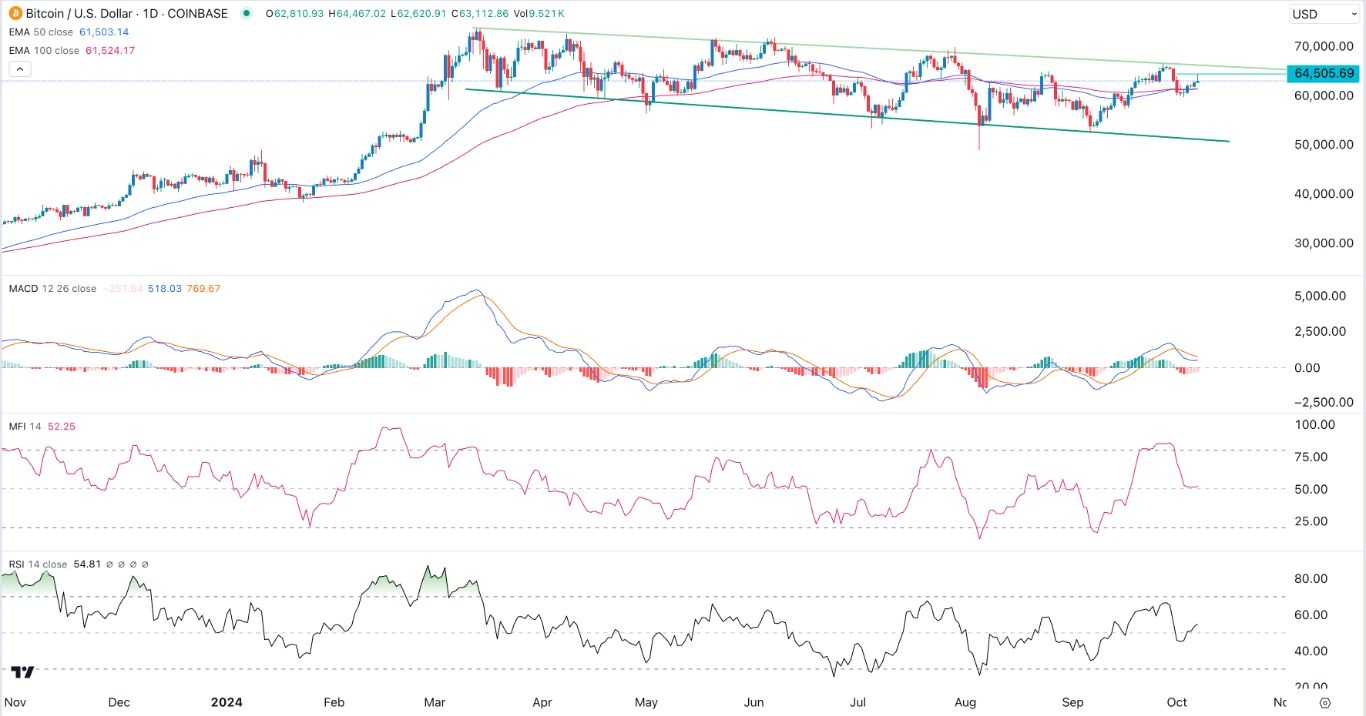
Bitcoin held steady in the overnight session even as American stocks continued its downward trend. The BTC/USD currency pair rose to 64,505, its highest point since September 30th.
Bitcoin’s rebound happened as the Dow Jones index retreated by almost 1% or 400 points. The Nasdaq 100 and the S&P 500 indices declined by 1.15% and 1%, respectively. They dropped by 230 and 56 points.
American bond yields also continued rising, with the 10-year and 2-year rose by 1.25% and 1.45% to 4.03% and 3.98%, respectively.
Top Forex Brokers
This performance was a continuation of what happened on Friday when the US published strong jobs numbers. According to the Bureau of Labor Statistics (BLS), the unemployment rate retreated to 4.2% while wage growth continued rising.
Bitcoin rose as signs showed that institutional investors were still investing in Bitcoin. MetaPlanet, a Japanese company, bought coins worth over $6.7 million.
Spot Bitcoin ETFs have also had some substantial inflows in the past few weeks. Data by SoSoValue shows that all spot ETFs have had over $18.5 billion in inflows, with the iShares Bitcoin ETF (IBIT) having the most assets. Some of the biggest companies that have invested in these ETFs are Blackrock, Millennium Management, and Citadel Securities.
Bitcoin rose in hopes of Donald Trump's victory in the election. Recent polling data shows he had a slight lead in some notable states.
Trump is often seen as a better candidate for Bitcoin because he has pledged to implement friendly regulations. At the same time, a report published on Monday showed that his policies would add over $7.5 trillion to the deficit. Many Bitcoin investors believe that it is a good haven because of the rising debt.
BTC/USD technical analysis
The BTC/USD pair rose slightly on Monday, even as stocks crashed. It has remained above the 50-day and 100-day Exponential Moving Averages (EMA).
However, it has also formed a bearish divergence pattern on the MACD and the Money Flow Index (MFI), pointing to more downside. The Relative Strength Index (RSI) has also remained at 50.
Therefore, Bitcoin will likely have a bearish breakout as sellers target the next reference point at $60,000. In the longer term, however, Bitcoin will have a bullish breakout if it moves above the descending green trendline.
Ready to trade our free daily Forex trading signals? We’ve shortlisted the best MT4 crypto brokers in the industry for you.
