Bearish view
- Sell the GBP/USD pair and set a take-profit at 1.3150.
- Add a stop-loss at 1.3325.
- Timeline: 1-2 days.
Bullish view
- Set a buy-stop at 1.3275 and a take-profit at 1.3350.
- Add a stop-loss at 1.3150.
The GBP/USD exchange rate pulled back sharply as investors embraced a risk-off sentiment in the market. It pulled back to a low of 1.3270, a few pips below the year-to-date high of 1.3430.
The pair retreated after the relatively stronger-than-expected jobs numbers from the United States. On Tuesday, a report showed that the number of job vacancies rose to over 8 million in August.
A separate report by ADP showed that the number of private payrolls increased by 143k in September, higher than the median estimate of 137k. It also revised upwards its August estimate from 99k to 113k.
Strong jobs numbers will likely push the Federal Reserve to be more cautious when cutting interest rates in the coming meetings. Officials like Jerome Powell and Raphael Bostic have called for caution when cutting rates.
The next important data will be the UK and US services and composite PMIs followed by the US nonfarm payrolls data.
Top Forex Brokers
GBP/USD Technical Analysis
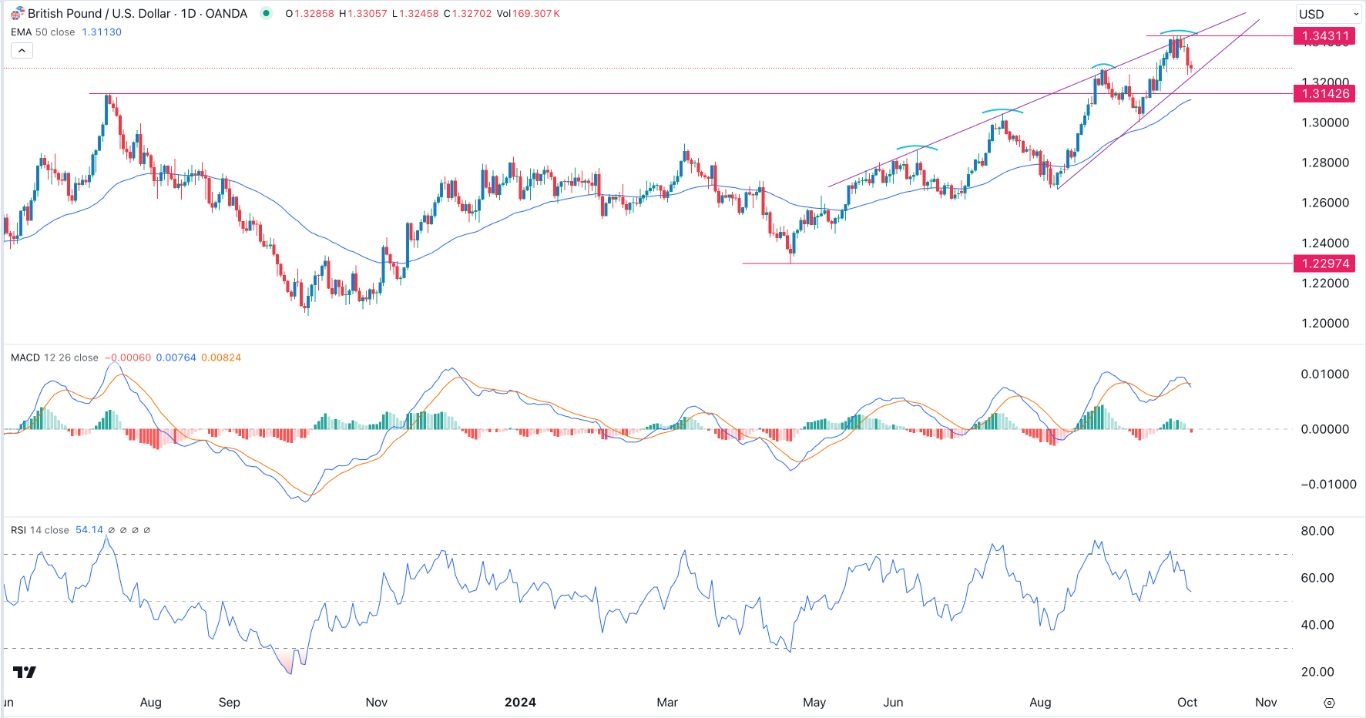
The daily chart shows that the GBP/USD exchange rate has been in a strong uptrend after bottoming at 1.2297 in May. It has formed a series higher highs and higher lows and remained above the 50-day Exponential Moving Average (EMA).
The GBP/USD pair also rose above the key resistance point at 1.3142, its highest swing in July last year. Also, the MACD has remained above the neutral point while the Relative Strength Index (RSI) has drifted downwards.
Meanwhile, it has formed a rising wedge pattern, which is nearing the apex. In most periods, this pattern is usually a more bearish sign. Therefore, the pair will likely continue falling as sellers target the next key point at 1.3142.
GBP/USD 4H analysis
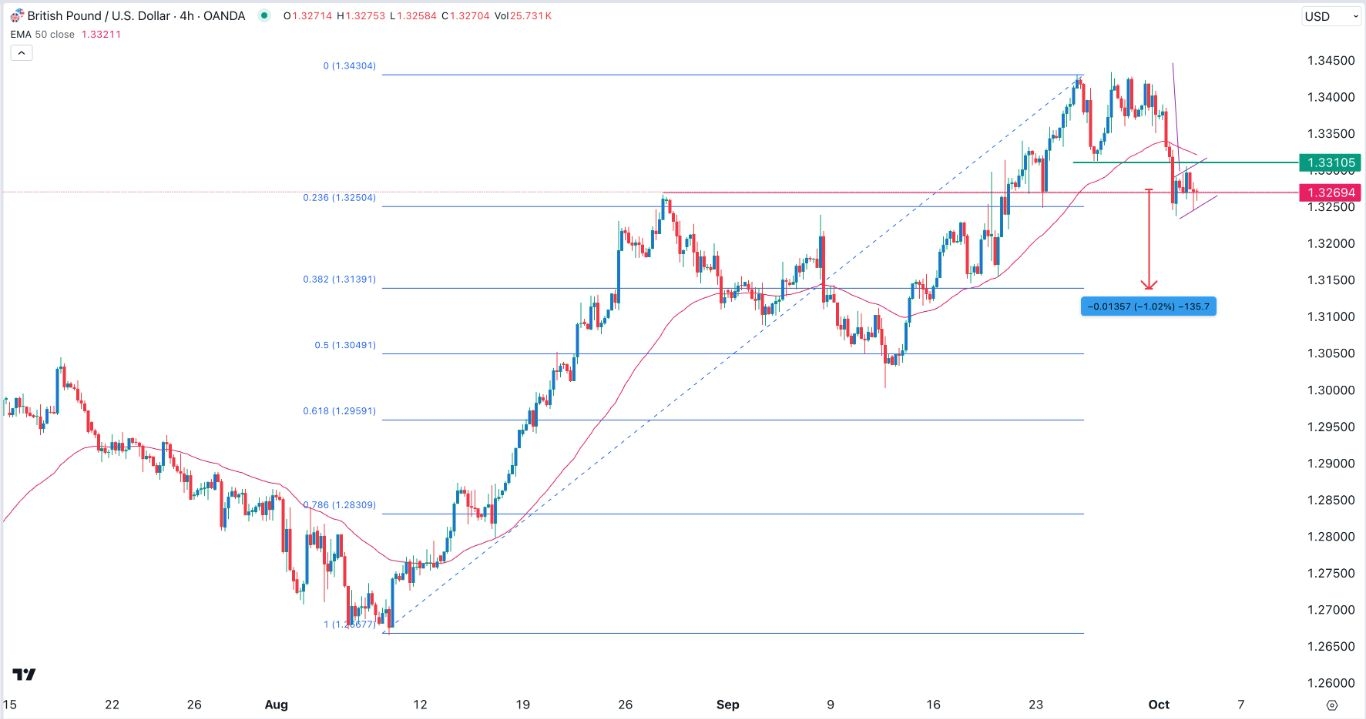
On the four-hour chart, the pair peaked at 1.3430, where it formed a small double-top chart pattern. It has also moved slightly below the important support at 1.3310, its lowest point on September 25, and its neckline.
The pair has formed a bearish flag chart pattern, which is characterized by a long vertical line and a consolidation.
It has also moved to the 23.6% Fibonacci Retracement point, which also coincides with the highest point in August. The pair also flipped below the 50-period moving average.
Therefore, the pair will likely have a bearish breakout as sellers target the 38.2% Fibonacci Retracement point at 1.3140, down by 1% from the current level.
Ready to trade our free daily Forex trading signals? Get the most recommended Forex broker in the UK here.


