Bearish view
- Sell the GBP/USD pair and set a take-profit at 1.2900.
- Add a stop-los at 1.3150.
- Timeline: 1-2 days.
Bullish view
- Set a buy-stop at 1.3100 and a take-profit at 1.3200.
- Add a stop-loss at 1.2900.
The GBP/USD pair continued retreating, falling to its lowest point since September 12 as the US dollar index (DXY) and Treasury yields bounced back. It dropped to 1.3075, down by over 2.70% from the year-to-date high of 1.3430.
US dollar index and Treasury yields rise
The GBP/USD pair has been in a strong downtrend because of the strong US dollar, higher energy prices, and soaring Treasury yields.
The US dollar index (DXY) has risen in the last six consecutive days, reaching a high of $102.52, its highest level since August 16.
Crude oil prices have also jumped, with Brent and the West Texas Intermediate (WTI) reaching a high of $81 and $77.5, respectively.
Top Forex Brokers
Higher oil prices mean that inflation will likely remain at an elevated level for a while and push the Fed and other central banks to slow down their rate cuts. As a result, US Treasury yields continued rising, with the 10-year hitting the key resistance point at 4% and the 30-year rising to 4.30%.
The odds of a less dovish Federal Reserve rose after the US published strong jobs numbers on Friday. According to the Bureau of Labor Statistics (BLS), the unemployment rate retreated to 4.1% in September as the economy created over 254k jobs.
There will be no major economic data from the UK and the US on Tuesday. Therefore, traders will be focusing on the upcoming Federal Open Market Committe (FOMC) minutes and US inflation data.
These minutes will provide more information about the last meeting and what officials deliberated on.
GBP/USD technical analysis
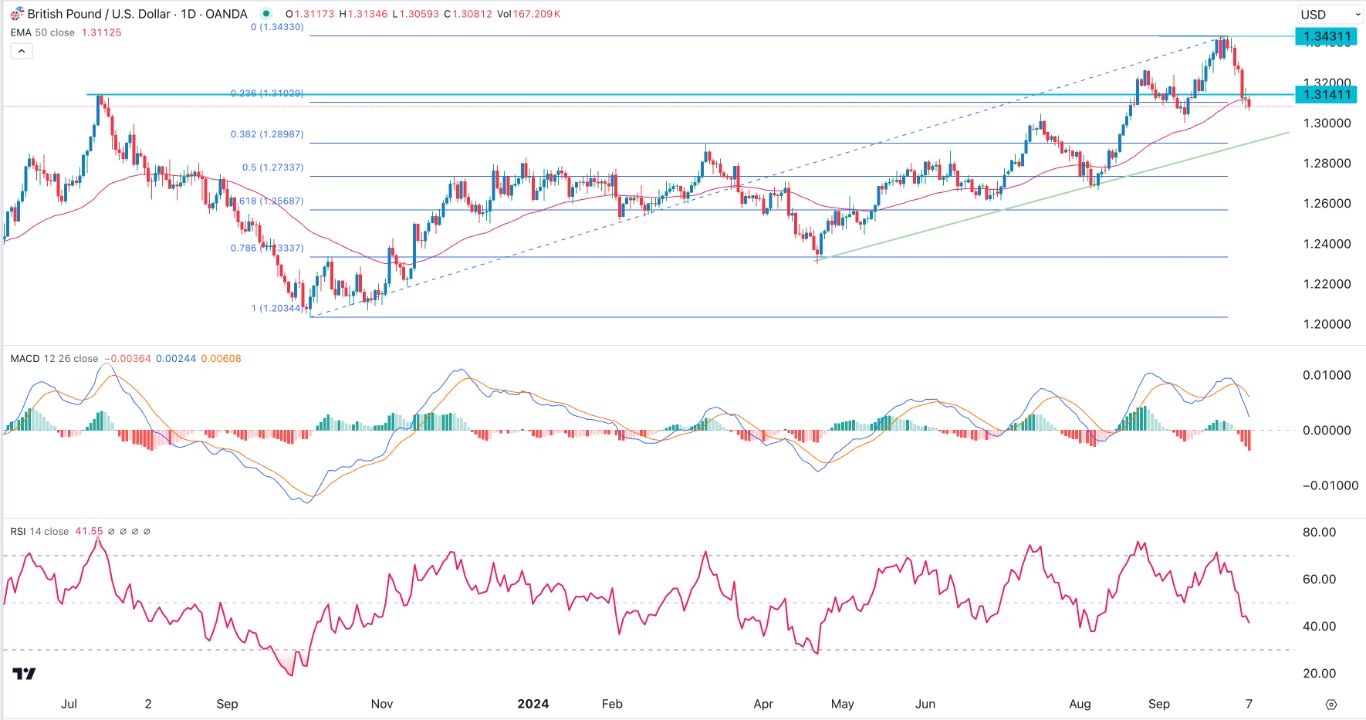
The GBP to USD exchange rate rallied and peaked at 1.3431 last month. It has then reversed and dropped below the important support level at 1.3141, its highest level in July last year.
The pair has also moved slightly below the 50-day Exponential Moving Average (EMA) and the 23.6% Fibonacci Retracement point.
Meanwhile, the two lines of the MACD have formed a bearish crossover pattern while the histogram bars have been in the red in the past four consecutive days. The Relative Strength Index (RSI) has pointed downwards.
Therefore, the pair will likely continue falling as bears target the 38.2% Fibonacci Retracement point at 1.2900. This price also coincides with the ascending trendline that connects the lowest swings since April.
Ready to trade our free trading signals? We’ve made a list of the best UK forex brokers worth using.


