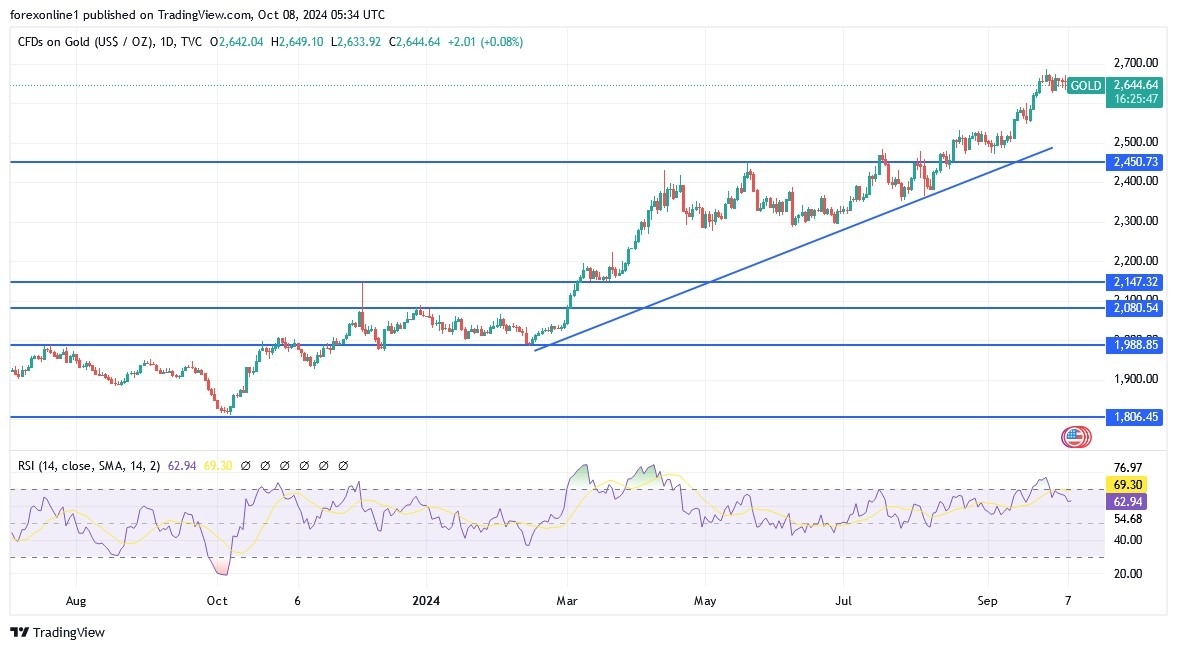
- Gold price recorded its first weekly loss after trading in the green for three consecutive weeks.
- In recent sessions, it has been trading sideways while remaining close to a new all-time high it recorded about a week ago.
- At the beginning of this week's trading, the gold price declined to the support level of $2637 per ounce, giving up its recent record levels that reached the resistance level of $2685 per ounce.

According to the results of the economic calendar, the stronger-than-expected US jobs report indicated a strong Labor market, which increased bets on a less aggressive 25 basis point US interest rate cut. The US dollar then increased its gains as Treasury yields rose, which increased the alternative cost of holding non-yielding bullion. Meanwhile, geopolitical tensions in the Middle East supported gold price due to its safe-haven status. Investors are concerned about the escalation of the current conflicts between Israel and Iran.
US Job Market
Data released last Friday by the US Department of Labor showed that US non-farm payrolls increased by 254,000 jobs in September. The figure exceeded expectations of an additional 147,000 jobs, as well as 159,000 jobs in the previous month. Average hourly earnings also rose 0.4% on a monthly basis. While the figure was lower than the 0.5% in August, it came in higher than the expected 0.3%. At the same time, the US unemployment rate declined from 4.2% in the previous month to 4.1%.
The stronger-than-expected US jobs report indicated that the country’s Labor market remains strong. This comes about two weeks after the Federal Reserve announced a massive interest rate cut in order to support the slowing Labor market. In addition to achieving price stability, the Federal Reserve is also keen to reach maximum employment. The latest jobs report coincides with comments from US Federal Reserve Chairman Jerome Powell at his latest press conference. In his speech, he stressed that the US Labor market is strong, adding that “the US economy is in good shape… The Labor market is strong, we want to keep it there. That’s what we’re doing.”
After the US jobs report for September, markets are betting on a more modest 25 basis point rate cut at its November meeting. In contrast, there is a growing disregard for a 50-basis point rate cut by the US central bank. After the massive rate cut by the Fed, gold prices rose more than 5% to a new record high of $2,687.47 per ounce. The rally was based on the fact that lower interest rates reduce the opportunity cost of holding non-yielding bullion. Moreover, the pressure on the US dollar made the precious metal less expensive for buyers holding foreign currencies.
At the same time, signs of a strong Labor market have strengthened the US dollar, making gold more expensive for buyers holding other currencies. On Friday, the US dollar retested a level last seen in late August. Similarly, benchmark 10-year Treasury yields rose to a two-month high, reducing investor interest in non-yielding assets.
Global Geopolitical Tensions
Additional gains in the US dollar weighed on the gold price index towards the end of the week. However, concerns over conflicts in the Middle East limited its downward movement. Iran launched nearly 200 ballistic missiles at Israel on Tuesday. While there were no fatalities as the Israeli and US militaries were able to intercept most of them, the attack has nonetheless heightened fears of a full-scale war in the region. Iran has warned the US against intervening while threatening a “strong response” if Israel retaliates.
When asked if the US would support Israeli attacks on Iranian oil facilities, US President Biden said, “We’re discussing it. I think it’s going to be a little bit… anyway.” As a traditional safe haven, gold continues to find support amid the tensions.
Top Forex Brokers
Gold Price Analysis and Forecast Today:
According to Gold Analysts’ Predictions Gold peaked at $2,685 on September 26 due to dovish Fed policy and rising geopolitical events. It has now been in a consolidation phase, forming a bullish flag pattern, which is often a positive sign. The gold price index has remained above the 50-day and 25-day EMAs. Also, it remains above the upper side of the rising wedge pattern that has been forming since March. Meanwhile, the MACD lines have formed a bearish crossover, while the Relative Strength Index (RSI) has formed a bearish divergence chart pattern. Therefore, gold is giving mixed signals, with the bullish flag pattern indicating further upside while the bearish divergence indicates further downside. Therefore, a break above the all-time high would signal further upside in the near term. If this happens, the next point to watch would be at $2,700. On the other hand, a break below $2,600 would signal further downside.
Ready to trade today’s Gold prediction? Here’s a list of some of the best XAU/USD brokers to check out.
