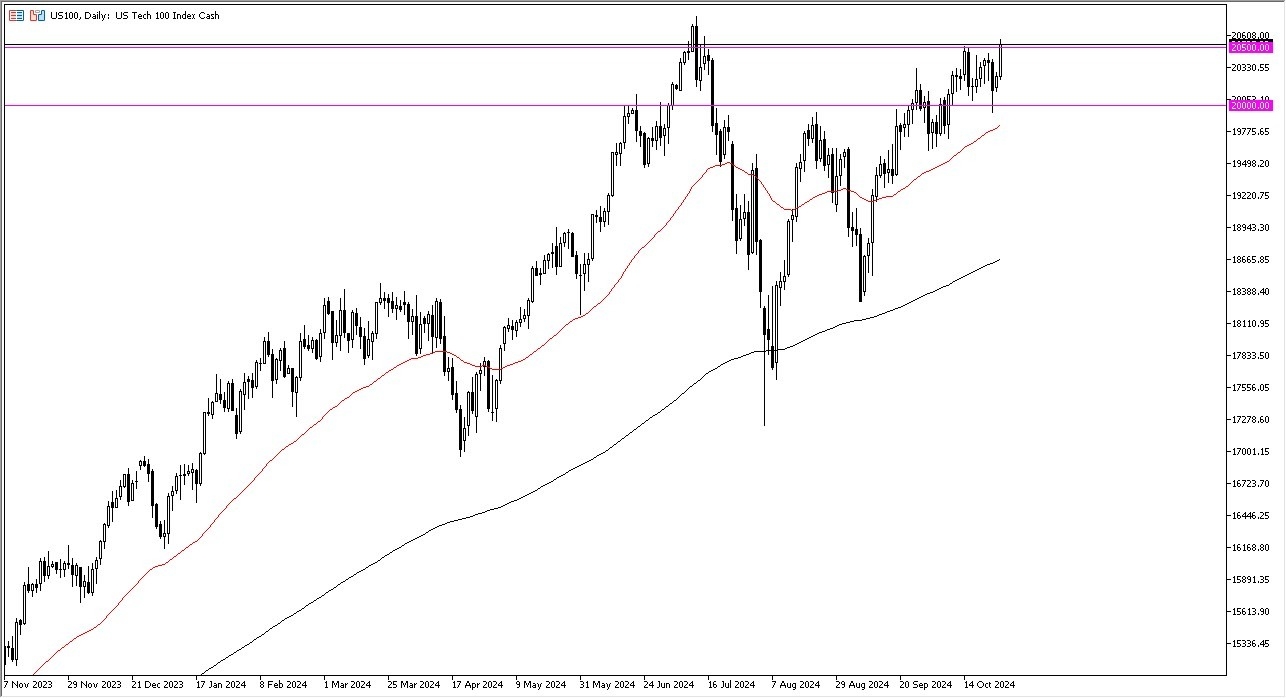
- The NASDAQ 100 continues to look pretty strong on Friday, as we are breaking the 20,500 level going into the weekend.
- The market continues to focus on a lot of things, most notably the earnings season going on at the moment, and the overall liquidity measures being taken by the Federal Reserve.

Looking at the chart, it’s obviously a bullish market, and it’s a market that looks as if it is trying to break above the recent all-time highs.
Top Forex Brokers
Whether or not we can do that remains to be seen, but quite frankly there’s nothing on this chart that tells me it cannot. Because of this, I’m looking at short-term pullbacks as a potential buying opportunities, which gives you a shot to pick up “cheap contracts” in the NASDAQ 100, and I think at this point in time short-term pullbacks will end up being buying opportunities, as it can give you an idea that you are finding value.
Technical Analysis
The technical analysis for this market of course is very bullish, and I think that will continue to be the case. The 50 Day EMA is racing toward the 20,000 level, which is the bottom of the overall large consolidation area that we had been in over the last several weeks.
I think that it’s essentially going to be your “floor in the market” going forward, and therefore I think you’ve got a situation where there’s absolutely no reason to start selling this market, but if we were to break down below the 20,000 level, then we could see a much deeper correction.
If we do break out to the upside and get above the recent high, then I think the market is likely to go looking to the 21,000 level after that. The market is likely to continue to see a lot of volatility, but I do think that the overall momentum is for the upside and not the down. All things being equal, I remained very bullish.
Ready to trade our stock market analysis? Here’s a list of some of the best CFD trading brokers to check out.
