Fundamental Analysis & Market Sentiment
I wrote on 29th September that the best trade opportunities for the week were likely to be:
- Long of the GBP/USD currency pair following a daily close above $1.3458.
- Long of Gold in USD terms following a daily close above $2,685.
- Long of the S&P 500 Index following a daily close above 5,768 on a relatively large bullish candlestick with little upper wick.
None of these opportunities set up during the past week.
Top Forex Brokers
Last week’s key takeaways were:
- US Non-Farm Payrolls and Average Hourly Earnings – the key US jobs and earnings data both came in considerably higher than expected, with 254k net new jobs created when only 147k were expected. Average Hourly earnings increased month-on-month by 0.4%, higher than the consensus forecast of 0.3%. This shifted sentiment towards a more hawkish Fed following Fed Chair Powell’s cautious talk a few days earlier. The US Dollar and its treasury yields rose strongly, with the Dollar making its biggest weekly gain in years.
- German Preliminary CPI (inflation): This was lower than expected, showing no month-on-month change despite a forecasted increase of 0.1%.
- Eurozone CPI (inflation) Flash Estimate – this was exactly as expected.
- Swiss CPI (inflation): This came in notably lower than expected, showing a month-on-month deflation of 0.3% when a deflation of only 0.1% was anticipated.
- US JOLTS Job Openings: This was stronger than expected, boosting the hawkish effect of the high NFP number mentioned above.
- US ISM Services PMI – this was a fraction higher than expected.
- US ISM Manufacturing PMI – this was a fraction lower than expected.
- US Unemployment Claims – this was almost exactly as expected.
The Week Ahead: 7th - 11th October
The coming week’s schedule is much lighter than last week but includes the most important data item of all, US inflation data, as well as FOMC Meeting Minutes and a policy meeting at the Reserve Bank of New Zealand:
- US CPI
- US PPI
- US FOMC Meeting Minutes
- UK GDP
- RBNZ Cash Rate & Rate Statement
- US Unemployment Claims
- Canadian Unemployment Rate
It is a public holiday in China and Australia on Monday.
Monthly Forecast October 2024

I forecasted that the EUR/USD currency pair would rise in value during September. It did, by 0.81%.
I forecasted that the EUR/USD currency pair would rise in value for October. Its performance so far is as follows:

Weekly Forecast 6th October 2024
Last week, I made no weekly forecast, as there were no unusually large price movements in currency crosses, which are the basis of my weekly trading strategy.
This week, five currency crosses moved by more than 2%, but I prefer to wait to trade this until we have at least 7 crosses doing so. There may be a small probability of the following directional movements over the coming week, however:
- Short EUR/JPY
- Short GBP/JPY
- Short CAD/JPY
- Short AUD/JPY
- Short CHF/JPY
The Japanese Yen is by far the most volatile major currency and looks likely to stay that way/
Directional volatility in the Forex market rose strongly last week—70% of the most important currency pairs and crosses fluctuated by more than 1%.
Last week, the US Dollar was the strongest major currency, while the Japanese Yen was the weakest.
You can trade these forecasts in a real or demo Forex brokerage account.
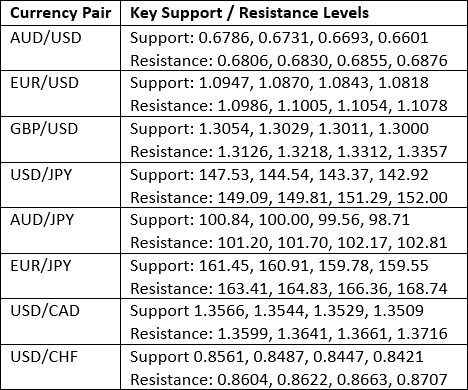
Key Support/Resistance Levels for Popular Pairs
Technical Analysis
US Dollar Index
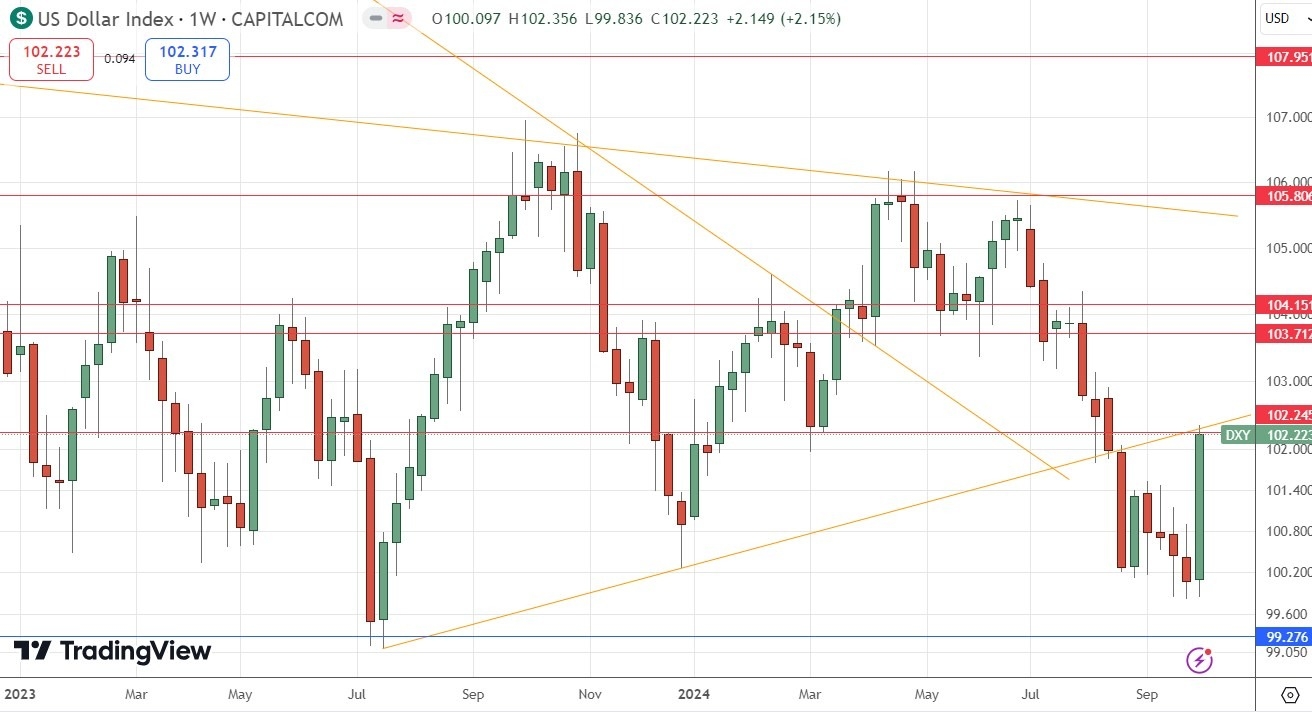
Last week, the US Dollar Index printed an extremely large bullish candlestick that almost completely engulfed the previous seven weeks of price action. It was the greenback's biggest advance in one week that the market had seen in years. The price ended the week very near the high of the range. These are all bullish signs.
Despite these bullish signs, the price is still below its levels from three and six months ago, suggesting a long-term bearish trend in the greenback, which is a bearish indication.
It is also worth noting that despite the strong bullish momentum, the price advance may have been halted by the lower trend line of the formerly dominant consolidating triangle chart pattern and the horizontal resistance level at 102.25.
This week's outlook for the US Dollar is very unclear, as there are fundamental and sentiment reasons for its sudden strengthening. The Federal Reserve will likelytake a more dovish approach following the much stronger than expected non-farm payrolls and average earnings data released on Friday, which shows that there is still plenty of life in the US economy. Markets are now expecting a 0.25% rate cut at each of the forthcoming Fed meetings, which will occur over the remainder of 2024.
The outlook is made even more complicated by US CPI (inflation) data due this week, which is likely to have a big effect on the price of the USD.
I recommend not trading the US Dollar this week due to this uncertain outlook, except incidentally.
USD/JPY
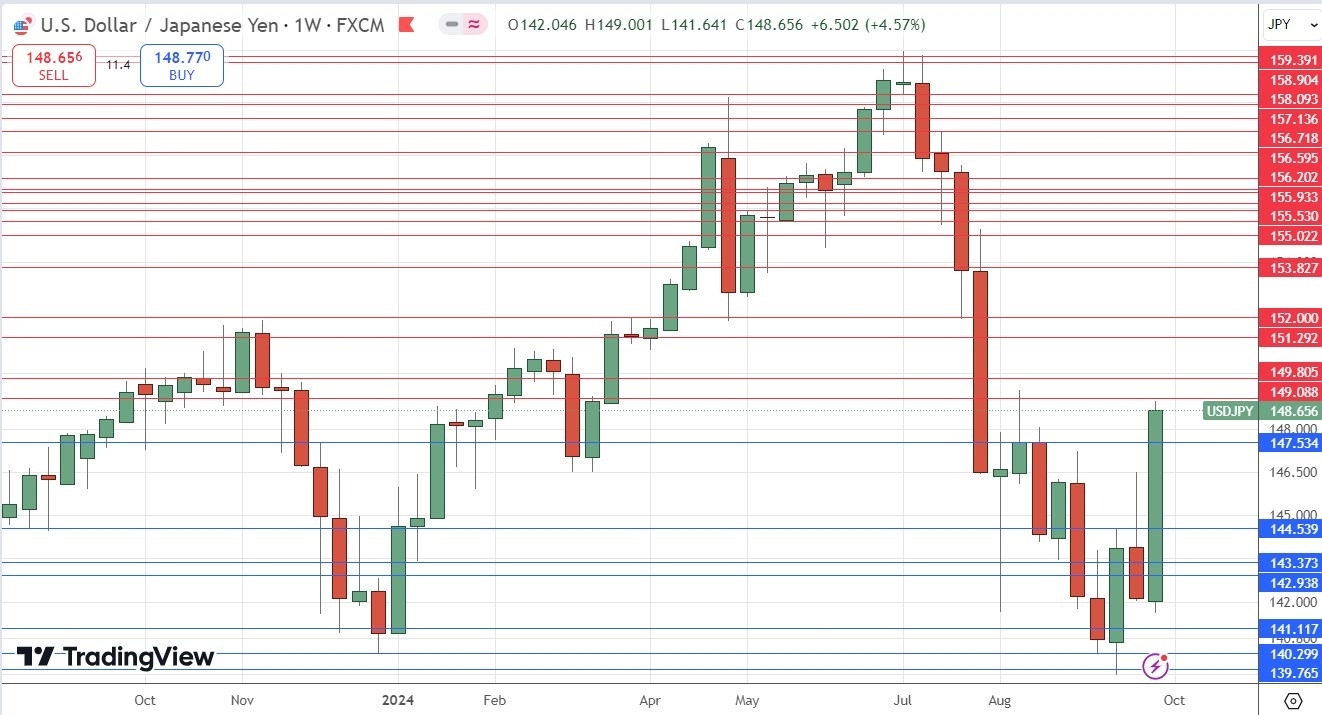
The USD/JPY currency pair behaved very similarly to the US Dollar Index last week, printing a massive bullish candlestick that closed very near the high of its range. This is the biggest weekly price rise this currency pair has seen in the market in years.
This has more to do with the newfound strength of the US Dollar than with the weakness of the Japanese Yen. In fact, the new Japanese Prime Minister is seen as likely to bring about a stronger program of rate hikes over the medium term, and that has not changed. However, the new renaissance in risk sentiment has helped to weaken the yen as it also acts as a haven, and markets do not need any haven right now, except maybe the US dollar, which seems well-positioned to fulfil that function.
All these factors point towards strong bullish momentum and a bullish outlook. This may be true, especially as the Yen has not fallen so strongly everywhere and might not be due a rebound over the coming week. Yet a reversal is quite possible, and the high volatility we have seen in the Japanese Yen for some time is likely to continue, whether the price is rising or falling. This will make a low-spread, high-volatility currency pair such as this one very attractive to day traders over the coming week.
If we see a bearish reversal, it could occur close to the big round number at ¥150 as a bearish double top.
XAU/USD
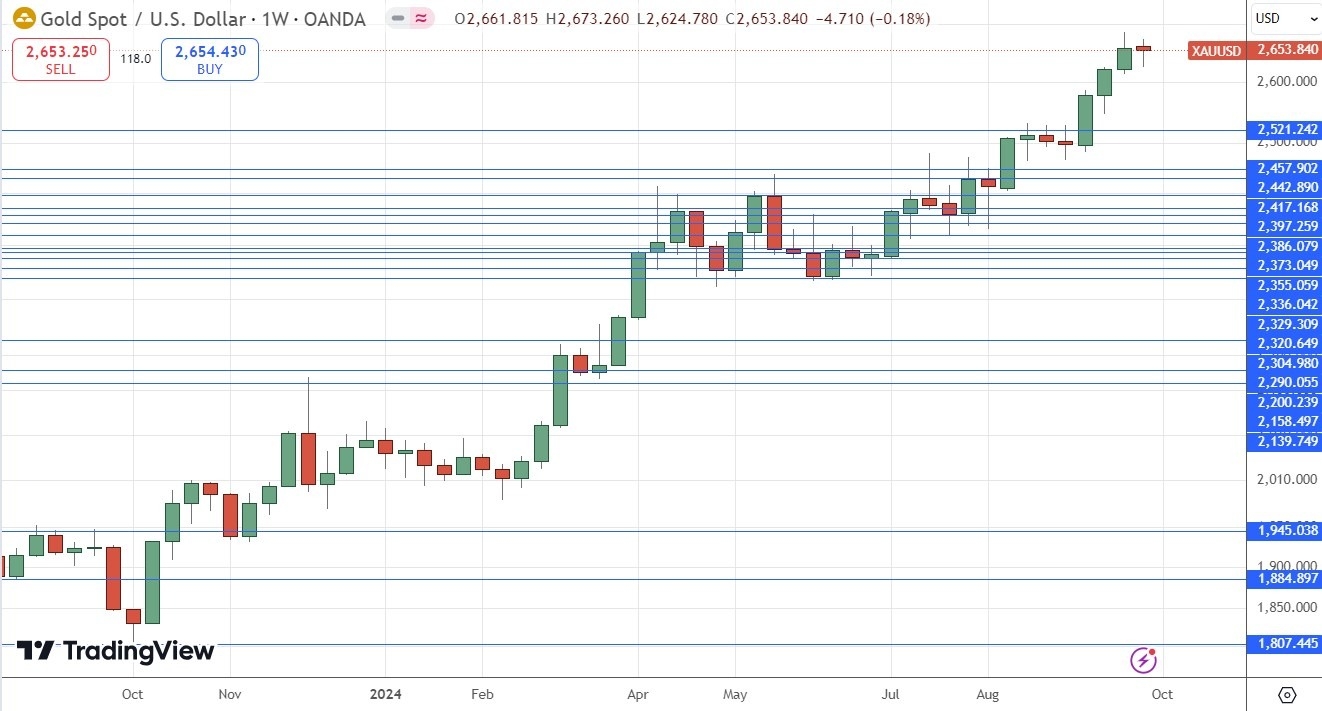
Last week, I wrote that Gold was a buy but only following a daily close at a new record high price. This was a good call, as the week's price action only printed a small inside candlestick, which was also a doji, signifying indecision.
Many assets reversed strongly last week against a resurgent US Dollar, but the fact that Gold did not is a bullish sign.
Despite Gold's reputation as a risk hedge, historically, the price of Gold has tended to be positively correlated with major stock market indices. Therefore, whether the price of gold rises further over the short term depends on risk sentiment and US CPI data. If US inflation continues to run hot and a full-scale war breaks out between Iran and Israel this week, we will probably see risk sentiment deteriorate and the price fail to make a significant bullish breakout.
I still see Gold as a buy, but only following a daily close at a new record high price.
S&P 500 Index
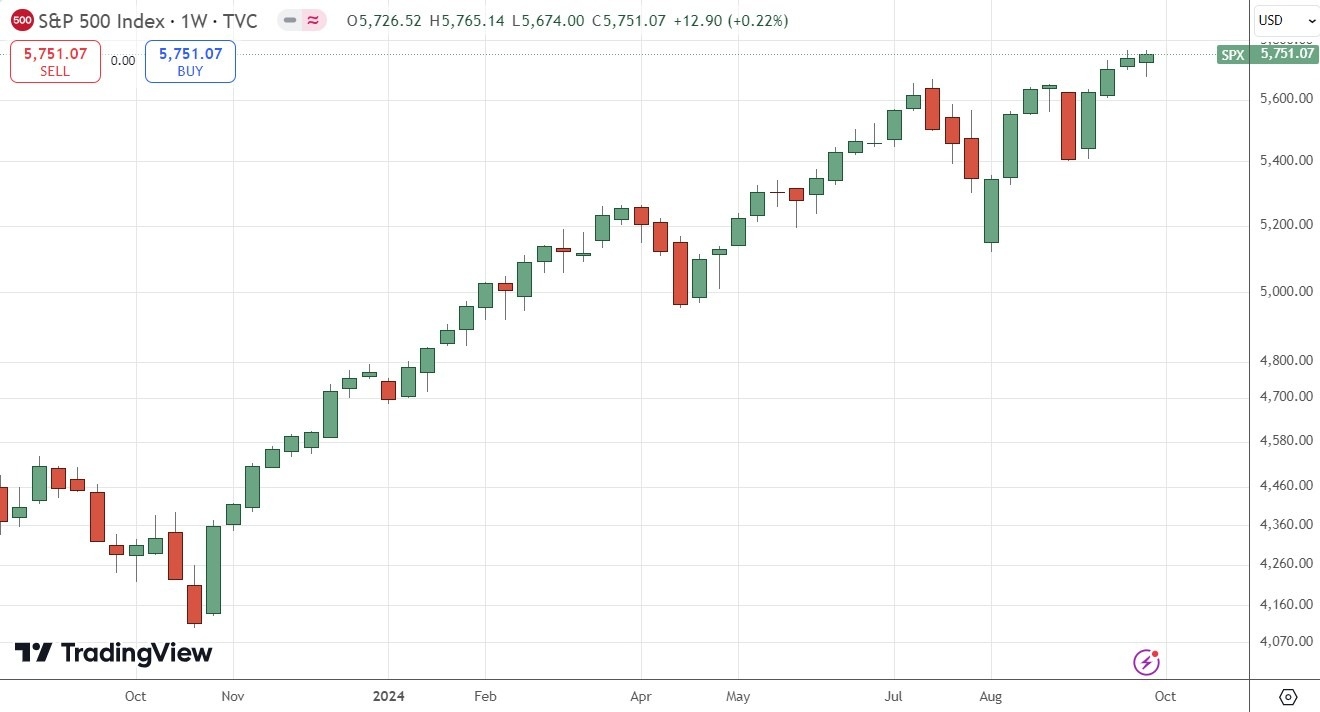
For the third week in a row, the price ended the week at a new record high weekly close. However, even though it printed a bullish candlestick, the price was not quite able to break to a new all-time high last week.
The fact that the price action remained bullish despite the massive advance in the US Dollar, which would tend to drag down the price of this equity index, is a bullish sign that the price could rise much further. Another factor indicating a bullish outlook is that when new record highs are made in this Index, the price has typically risen by about 12% over the next year.
Due to the risk of stock markets being hit by the outbreak of full-scale war between Iran and Israel while respecting the bullish technical position, I would be prepared to enter a new long trade here if we get a fresh daily close above 5,768 on a relatively large daily range, i.e. a bullish candlestick of good size without much upper wick.
Bottom Line
I see the best trading opportunities this week as:
- Long of Gold in USD terms following a daily close above $2,685.
- Long of the S&P 500 Index following a daily close above 5,768 on a relatively large bullish candlestick with little upper wick.
Ready to trade our weekly Forex forecast? Check out our list of the best Forex brokers.
