Bearish View
- Sell the GBP/USD pair and set a take-profit at 1.2300.
- Add a stop-loss at 1.2650.
- Timeline: 1-2 days.
Bullish View
- Buy the GBP/USD pair and set a take-profit at 1.2650.
- Add a stop-loss at 1.2300.
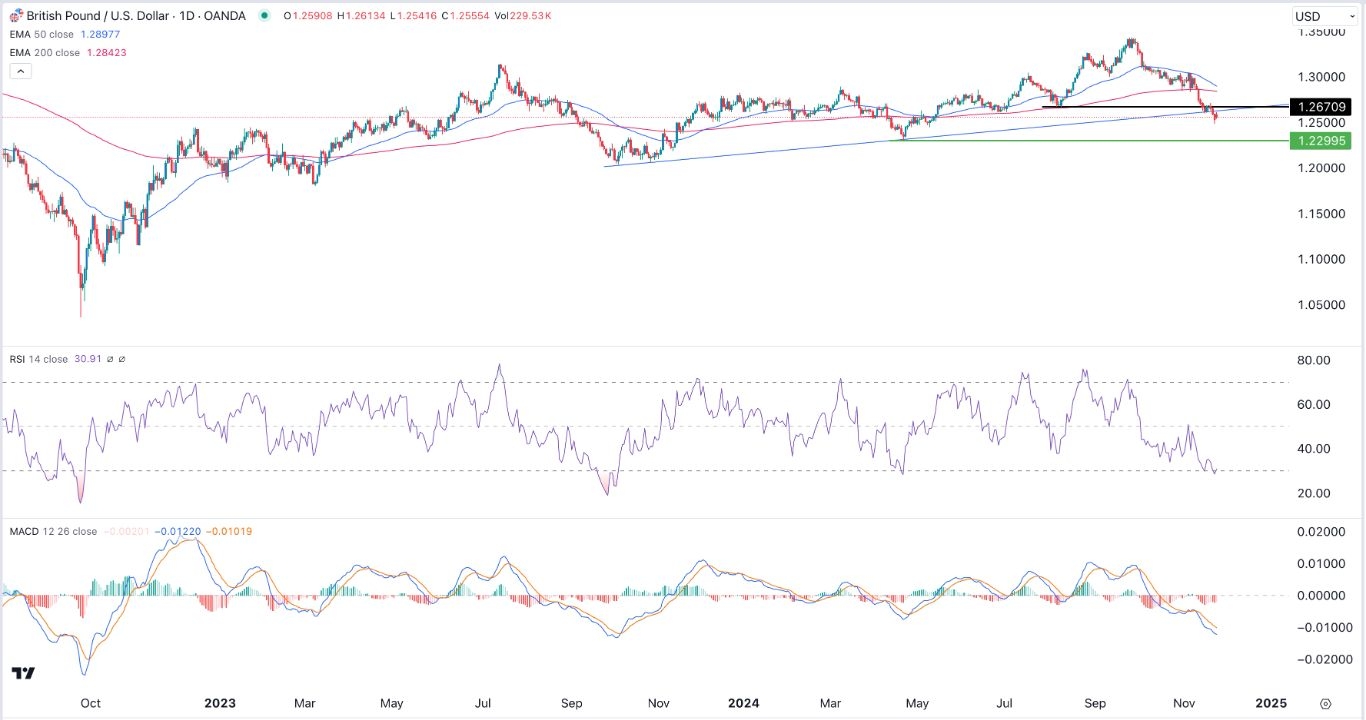
The GBP/USD exchange rate continued its downtrend even as the US dollar index (DXY) dropped ahead of the Federal Reserve minutes and the consumer confidence data. The pair was trading at 1.2553 on Tuesday morning, which was lower than this month’s high of 1.3433.
Top Forex Brokers
US Consumer Confidence and FOMC Minutes
The GBP/USD pair has been in a strong downward trend as traders embraced a risk-off sentiment after Donald Trump’s election.
It has also dropped after signs emerged that the Federal Reserve will be relatively hawkish in the next meeting. Recent economic data showed that the headline Consumer Price Index (CPI) rose from 2.4% in September to 2.6% in October. Core inflation, which excludes the volatile food and energy prices, remained at 3.3%.
Economists believe that some of Trump’s like tariffs and mass deportations will be highly inflationary. For example, deporting millions of farm and construction workers may lead to higher food and house prices.
The next key catalyst for the GBP/USD exchange rate will be the US consumer confidence report. Economists expect the data to show that consumer confidence rose from 108.7 in October to 112 in November. A higher consumer confidence figure is a positive sign for the economy because consumer confidence is the biggest part of the GDP.
The US will also release the latest house price index data, while the Federal Reserve will release minutes of the last meeting. These minutes will provide color on what went on in the last meeting and what to expect in the coming ones.
GBP/USD Technical Analysis
The GBP/USD exchange rate continued its downtrend this week. It has dropped below the ascending trendline that connects the lowest swings since October last year. Moving below that level is a sign that bears have prevailed.
The pair is about to form a death cross pattern as the 50-day and 200-day Exponential Moving Averages (EMA) cross each other. In technical analysis, this is one of the most bearish signs in the market.
The pair’s Relative Strength Index (RSI) and the MACD indicators have continued falling in the past few weeks. It has also dropped below the key support at 1.2670, its lowest swing on August 7.
Therefore, the path of the least resistance for the pair is bearish, with the next point to watch being at 1.2300, its lowest point on April 22. The stop-loss of this trade will be at 1.2600.
Ready to trade our free trading signals? We’ve made a list of the best UK forex brokers worth using.

