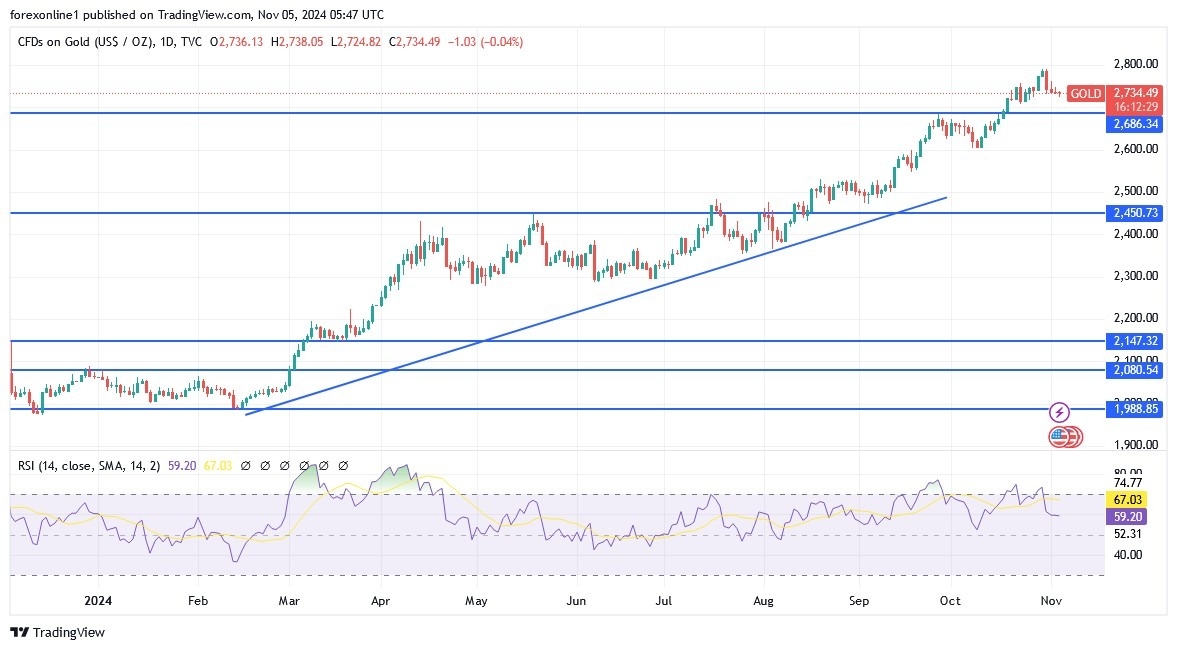
- Gold has surged by around 33% since the start of the year, hitting multiple record highs in recent months.
- In the week just ended, it hit a new record high of $2,790 per ounce before retreating to end the week at $2,736.40.
- Also, it is flat at the time of writing. It is worth noting that the declines during the ongoing rally have been subtle and short-lived.
- In fact, the precious metal has recorded gains in eight of the past ten months, remaining flat only in January and June.
- Amid ongoing geopolitical and financial uncertainty, safe-haven demand and FOMO buying are set to support gold prices to higher levels in the coming months.

Rising Flows
According to gold trading platforms, demand for gold bullion has surged significantly in the third quarter of the year, an aspect that has been reflected in its recent price movements. According to the World Gold Council, central bank buying and increased interest from high-net-worth investors have largely contributed to the surge in demand. The latest data from the council indicated that overall gold demand rose by 5% year-on-year to 1,313 tonnes, a record high in Q3. Furthermore, Q3 2024 marked the first time ever that the value of demand for the asset exceeded $100 billion, having increased by 35% year-on-year.
It is worth noting that global ETF inflows of 95 tonnes were a major contributor to the remarkable demand growth. In fact, the World Gold Council notes that Q3 2024 was the first positive quarter for ETF inflows since Q1 2022 when demand was boosted by Russia’s invasion of Ukraine and the subsequent freezing of the Bank of Russia’s assets. In comparison, Q3 2023 saw outflows of 139 tonnes.
For high-net-worth individuals and global central banks, uncertainty surrounding the US election and financial stability has boosted demand for gold as a safe haven. Admittedly, there are growing concerns about the sustainability of US debt to begin with. The country’s debt currently stands at $35 trillion, equivalent to 124% of GDP. This staggering figure has raised concerns among many entities, with the International Monetary Fund stating that the deficit is “so large it really needs to be resolved.”
Meanwhile, to reduce their exposure to US financial risks, more central banks and private investors are diversifying their portfolios to include more gold instead of US Treasuries. Furthermore, depending on who wins the US presidential election scheduled for November 5, concerns about the risk of Fed dependency and potential trade tensions have increased the appeal of gold among Western investors.
Top Forex Brokers
US Interest Rates
In the coming week, the focus will be on the US elections and the US Federal Reserve’s interest rate decision. Overall, both events are sure to increase volatility in financial markets, an aspect that has increased demand for gold as a hedge against uncertainty. Investors have certainly priced in a 25-basis point rate cut by the Federal Reserve during its two-day meeting in November, which is scheduled to end on November 7. Even with a strong US dollar and rising Treasury yields, the weak US non-farm payrolls report for October has boosted expectations of further monetary easing from the US central bank. However, the Fed’s decision may not be a major catalyst for the gold market.
In the hotly contested US presidential election, investors are keen to protect their wealth from political uncertainty by turning to gold. Depending on the winning candidate, international allegiances, foreign policy and domestic policy shifts are sure to ripple through financial markets. The resulting surge in demand for gold is expected to continue to support prices in the coming months. In fact, with these drivers, bulls are eyeing the previously unattainable milestone of $3,000 per ounce in 2025.
Gold Price Analysis and Forecast Today:
The weekly chart shows that the gold price index has been on a strong rise in the past few months, making it one of the best performing assets in the market. Technically, the gold price has been consistently above the 50-week and 200-week exponential moving averages (EMA). Meanwhile, the MACD has jumped to a multi-year high of 120. Also, the Relative Strength Index (RSI) has moved above the overbought level of 80. The Stochastic Oscillator has also risen to the overbought level. Moreover, it has formed a Doji pattern, indicating a possible pullback after the US elections and the Fed decision. If this happens, it could drop to the next point of $2,500.
Ready to trade today’s Gold prediction? Here’s a list of some of the best XAU/USD brokers to check out.
