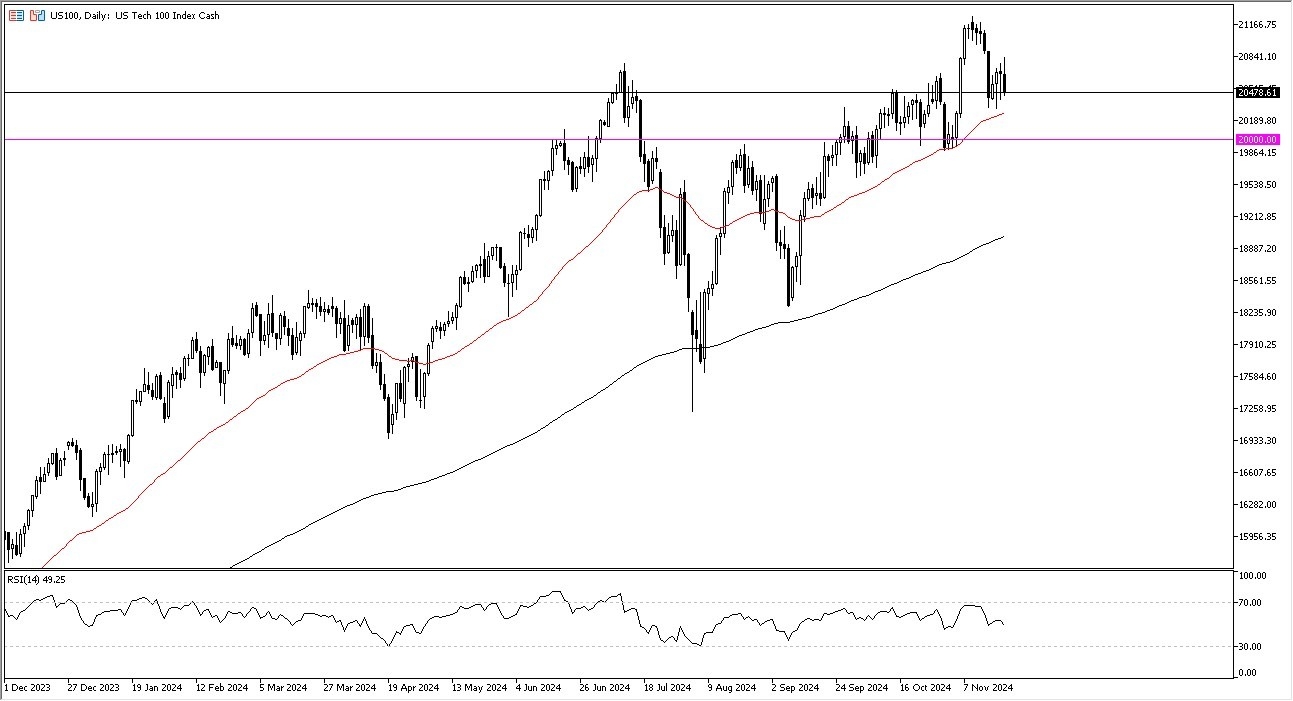
- During my daily analysis of NASDAQ 100 trading, the first thing that I would point out is that the volatility continues to be a major issue.
- After all, we have seen the market go both higher and lower during the trading session, as it is a market that is trying to do everything it can to figure out where to go next.
- In general, this is a market that I think continues to look toward everything that’s going on in the world and is trying to sort out what they need to do overall.

Technical Analysis
Top Forex Brokers
The technical analysis for the NASDAQ 100 is all over the place in the short-term, but the longer term is still very bullish. The 20,200 level is an area that is significant support, especially considering that we have the 50 Day EMA in that region as well, so it suggests that there are plenty of buyers willing to get involved on these dips. Furthermore, I would point out the fact that the market has turned around after plunging during the session as further proof that there are still plenty of buyers just below.
To the upside, the 20,800 level continues to be an area of resistance, but if we were to break above there, then it’s likely that we could go looking to the 21,200 level. The 21,200 level is an area that had previously caused significant resistance to cause the market to pull back. In general, this is a scenario where traders will continue to look at this through the prism of whether or not we can break out. If we can break above that level, then it’s likely that the NASDAQ 100 continues to go much higher. That being said, if we were to turn around a break down below the 20,000 level, I think we’ve got a situation where the market could start to fall pretty significantly, perhaps reaching down to the 200 Day EMA, presently sitting right around the 19,100 level and rising.
Ready to trade the daily stocks forecast? We’ve shortlisted the best Forex brokers for CFD trading in the industry for you.
