Bearish View
- Sell the GBP/USD pair and set a take-profit at 1.2600.
- Add a stop-loss at 1.2900.
- Timeline: 1-2 days.
Bullish View
- Buy the GBP/USD pair and set a take-profit at 1.2900.
- Add a stop-loss at 1.2600.
The GBP/USD pair remained in a tight range on Wednesday morning as traders waited for the upcoming US inflation data. It was trading at 1.2750, where it has been stuck at in the last two days.
Top Forex Brokers
The most important GBP/USD news of this week will come out when the Bureau of Labor Statistics (BLS) releases the latest consumer price index (CPI) data.
These numbers will provide more information about prices changes in the United States. Economists polled by Reuters expect the data to show that prices remained elevated in November.
The median estimate is that the headline CPI rose from 0.2% in October to 0.3% in September. Analysts also expect the annual figure to move from 2.6% to 2.7%, a sign that prices are moving in the wrong direction. It will be the second consecutive month of gains.
Core inflation, which excludes the volatile food and energy prices, is expected to come in at 3.3%, much higher than the Fed’s 2% target. Still, Fed officials who have talked recently have maintained their confidence that inflation was on a path to 2.0%.
Therefore, most of them have supported a 0.25% rate cut in the coming meeting, a move that will bring the year-to-date cuts to 1%.
The other key GBP/USD data to watch this week will be a data dump from the UK that will come out on Friday. That report will likely show that the economy expanded by 0.1% in October after contracting by 0.1% in the previous month.
All these numbers will help the Federal Reserve and the Bank of England when making their decisions next week.
GBP/USD Technical Analysis
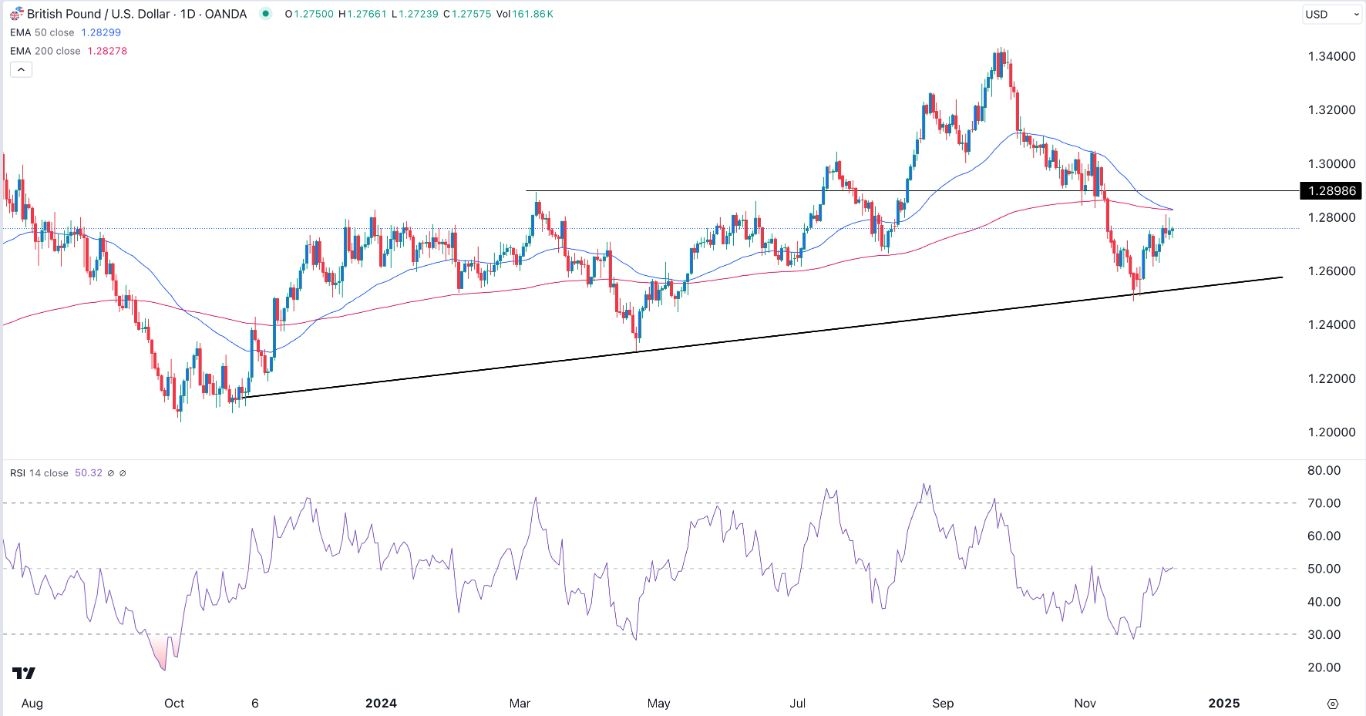
The daily chart shows that the GBP/USD exchange rate remained under pressure in the past few months. It has moved below the key support at 1.2898, its highest swing in March this year.
The pair is also about to form a death cross pattern as the 50-day and 200-day Exponential Moving Averages cross each other. Also, it has formed a rising wedge pattern, a popular bearish sign.
The Relative Strength Index has faced resistance at the neutral point at 50. Therefore, there is a likelihood that it will drop to the next point at 1.2600, which coincides with the ascending trendline that connects the lowest swings since November last year.
Ready to trade our free trading signals? We’ve made a list of the best UK forex brokers worth using.


