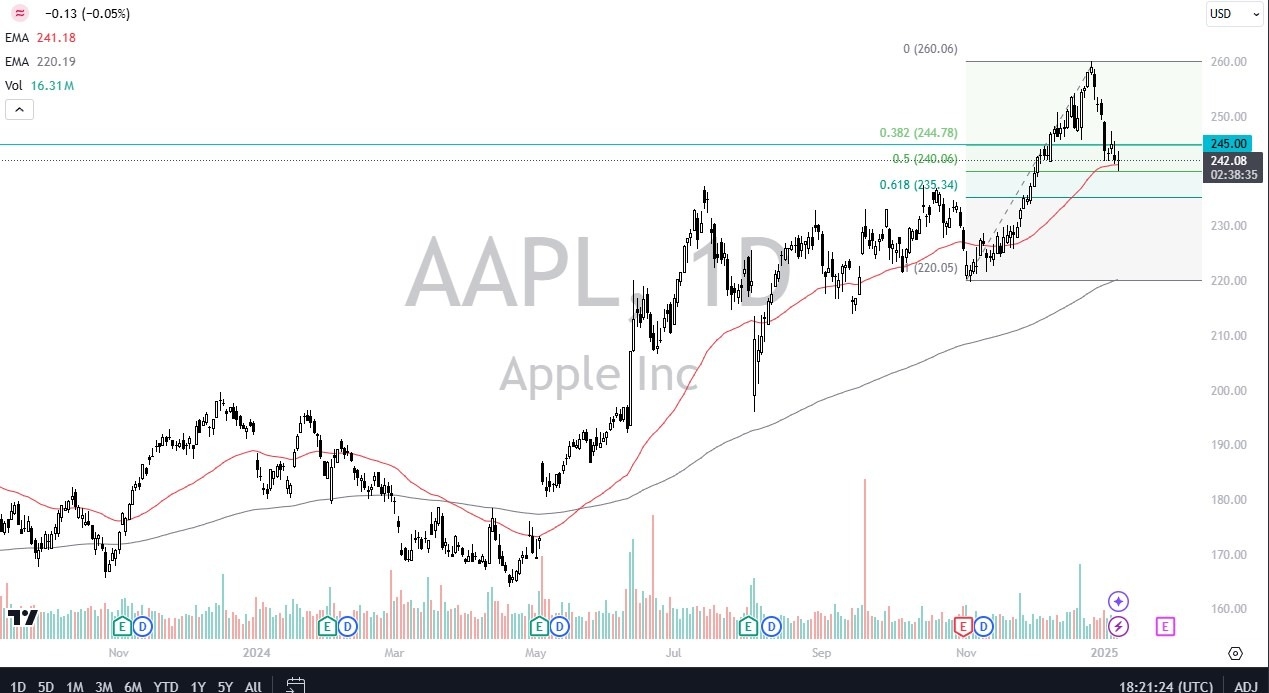
- The Apple chart looks rather interesting to me, and I thought I'd bring this to everybody's attention as we have dropped to test the 50 day EMA, which is an important technical analysis indicator.
- We also have tested the 50% Fibonacci retracement level only to bounce.
- That's something that captures the attention of technical traders everywhere.
I do believe that the $245 level above is a little bit of a barrier. So, if we can break above there, I think that would be a very positive sign. If we drop from here, then the $235.34 level is an area of support based on the 61.8% Fibonacci retracement level, and of course, previous action.
Top Forex Brokers
Keep in mind that Apple has an earnings call in about two and a half weeks, so that would have an influence on market participation, and earnings calls for April always tend to be a bit of a noisy affair. A lot of times Apple will rally into the earnings call and then sell off during it. So that makes this potential pullback and buying opportunity a little bit more intriguing as well. I have no interest in shorting Apple. It's one of those Wall Street darlings that you're just better off waiting to find an opportunity to buy it instead of fighting the “everybody buys Apple” narrative.
Long History of Strength
When you look at it, you can see how things have gone. Over the last 10 years or so, it's pretty much been straight up. There's been some years of consolidation, but everybody knows that had you bought Apple a while back, you'd probably be wealthy. I think that continues to be the attitude that we see, and eventually we will go looking to the $260 level. In the short term though, I'm watching $245 for a daily close above it to get long again.
Ready to trade our stock market forecast and analysis? Here are the best CFD stocks brokers to choose from.


