Bullish view
- Buy the BTC/USD pair and set a take-profit at 105,000.
- Add a stop-loss at 92,000.
- Timeline: 1-2 days.
Bearish view
- Sell the BTC/USD pair and set a take-profit at 92,000.
- Add a stop-loss at 105,000.
Bitcoin price drifted upwards as a risk-on sentiment spread in the financial market on Wednesday. The BTC/USD pair flirted with the important resistance point at 100,000 for the first time since January 7. It has jumped by almost 12% from its lowest level this week when it crashed below 90,000.
Bitcoin’s surge happened as other risky assets bounced back. The Dow Jones index rose by 700 points, while the S&P 500 and Nasdaq 100 indices soaread by almost 2%, turning positive for the year. The US dollar index dropped by 0.20%, while long and short-term bond yields fell by over 2%.
This price action was triggered by a report from the United States that revealed that inflation was easing. According to the Bureau of Labor Statistics, the core Consumer Price Index (CPI) dropped slightly in December. It dropped from 3.3% in November to 3.2% in December.
Top Forex Brokers
That report was encouraging since the core CPI has remained at 3.3% in the past few months. Therefore, if the trend continues, it may be a sign that the Federal Reserve will embrace a more dovish tone this year.
Still, there are rising odds that the bank will maintain a hawkish tone since inflation remains stubbornly higher than the Fed’s target of 2.0%. There are also other catalysts that may push it higher, including the upcoming Trump’s tariffs.
The BTC/USD pair also rose after more details about the incoming Donald Trump administration emerged. A report by Reuters showed that the SEC will pause some of the enforcement actions filed under Gary Gensler. Also, it plans to seek for comments for regulations as it seeks to make the country the crypto capital of the world.

BTC/USD technical analysis
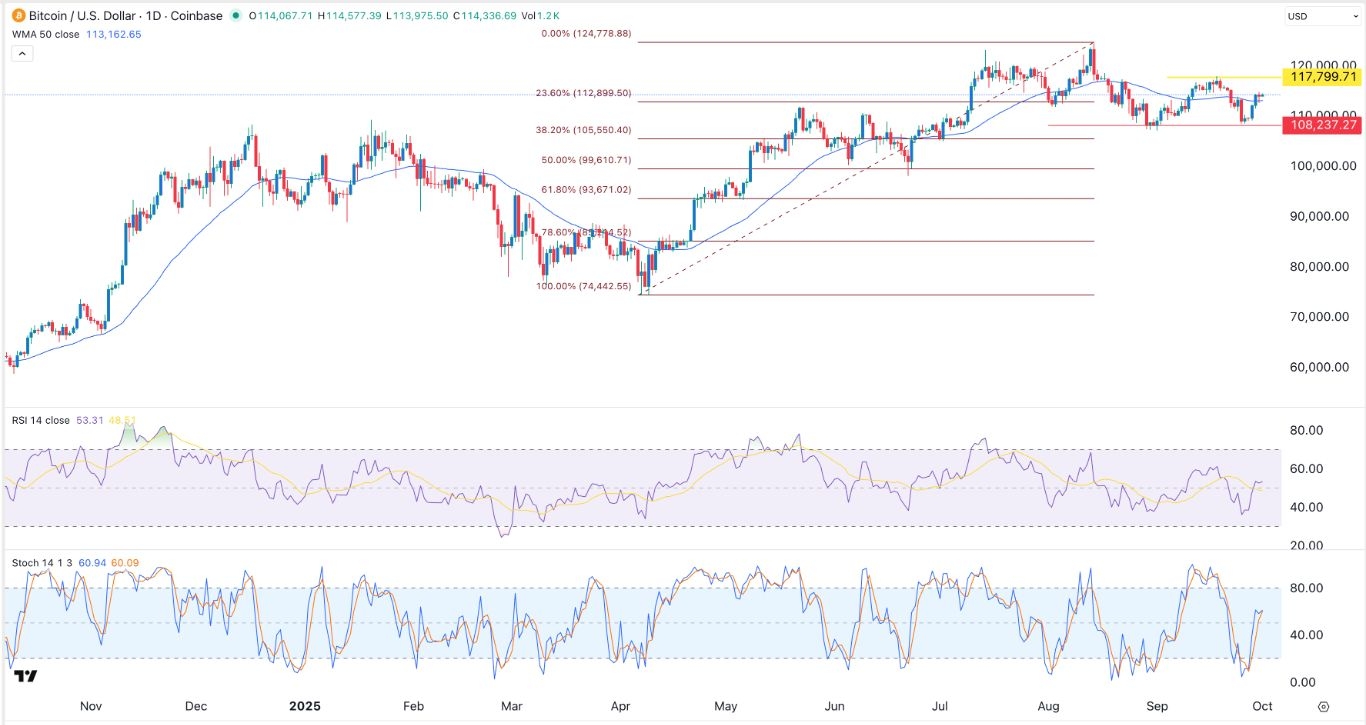
The BTC/USD pair crashed to a low of 89,000 on Monday and then bounced back to near 100,000. It rose above the 50-day and 25-day Exponential Moving Averages (EMA). Also, the two lines of the MACD indicator has formed a bullish crossover.
The pair has moved above the key support at 91,987, where it struggled to move below since November. Also, the Relative Strength Index (RSI) has moved above the neutral point at 50. Therefore, the pair will likely continue rising as bulls target the key resistance point at 105,000. A drop below the support at 96,000 will invalidate the bullish view.
Ready to trade our free trading signals? We’ve made a list of the top forex brokers in Australia for you to check out.
