Bearish View
- Sell the BTC/USD pair and set a take-profit at 91,000.
- Add a stop-loss at 101,000.
- Timeline: 1-2 days.
Bullish Pattern
- Buy the BTC/USD pair and set a take-profit at 101,000.
- Add a stop-loss at 91,000.

The BTC/USD pair moved sideways on Monday morning as the path towards the psychological point of 100,000 remained elusive. Bitcoin was trading at $98,000, about 7.4% higher than its lowest level on December 30th.
The BTC/USD pair has risen gradually even as the US dollar index (DXY) continued its strong uptrend and reached a multi-year high of $109.51. In most periods, assets traded in the US dollar lag underperform when it is in a strong rally.
Bitcoin’s wavering also happened as spot Bitcoin ETFs continued to see elevated demand. These funds had a net inflow of $908 million on Friday, the biggest increase in months. They now hold over $111 billion in assets, a figure that will continue growing in the next few months.
Bitcoin has also had other positive catalysts. For example, the popular Coinbase Premium Index has bounced back after falling to a 12-month low last week. This is an important index that compares the price of Bitcoin traded in Coinbase and other exchanges.
A higher figure is usually a sign that American investors are buying Bitcoin since most of them use Coinbase, the biggest exchange in the country.
Meanwhile, the amount of Bitcoins in exchanges has continued to drop, a sign that investors that are holding the coin.
Looking ahead, the next key catalyst to watch will be the upcoming economic data from the United States. The most important data to watch will be the upcoming US nonfarm payrolls (NFP) economic data.
Top Forex Brokers
BTC/USD Technical Analysis
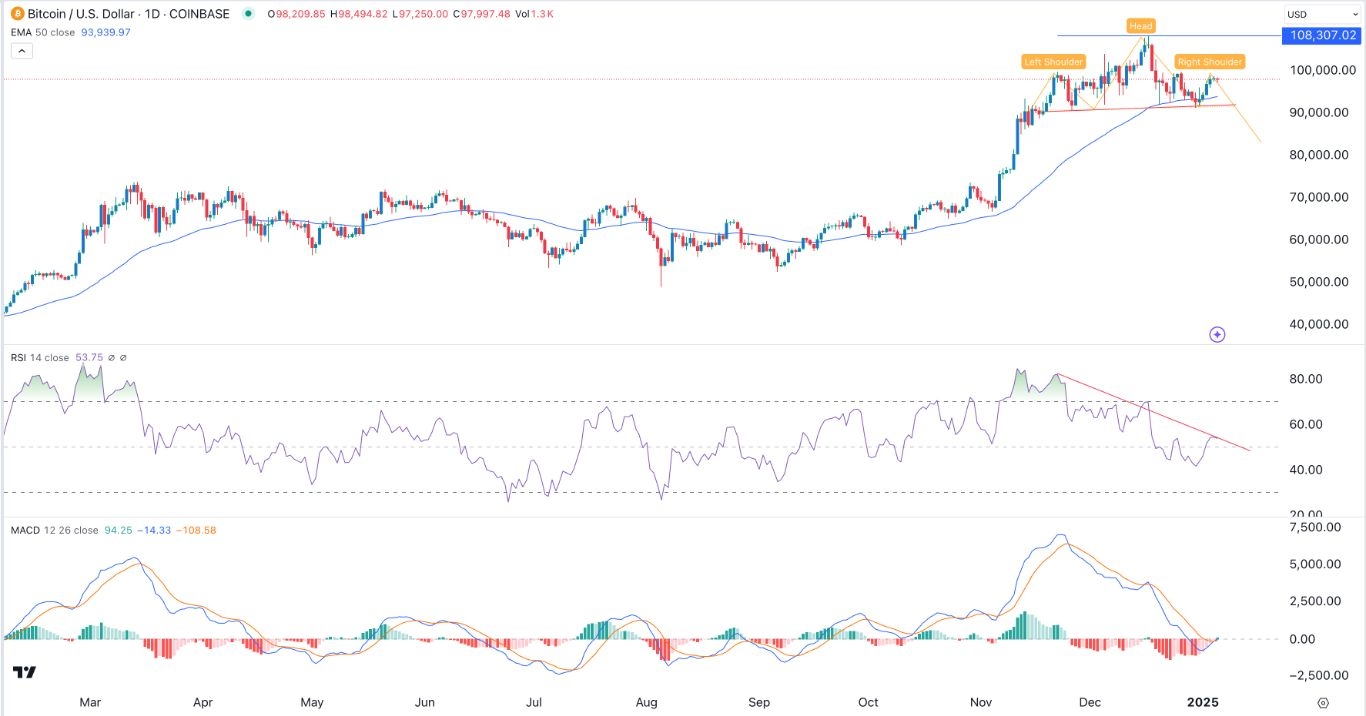
The daily chart shows that Bitcoin price peaked at $108,300 in December and then retreated to about $91,400. It has consistently remained above the 50-day moving average, a sign that bulls are in control for now.
However, there are signs that the coin has formed a head and shoulders chart pattern. This is one of the most bearish patterns in the market. The neckline of this pattern is around $91,400.
Also, the Relative Strength Index (RSI) and the MACD indicators have formed bearish divergence chart patterns.
Therefore, the pair will likely have a bearish breakout in the next few days as long as it remains below the resistance at $100,000. If this happens, the next point to watch will be at $91,000.
Ready to trade our free daily Forex trading signals? We’ve shortlisted the best MT4 crypto brokers in the industry for you.
