Bearish view
- Sell the BTC/USD pair and set a take-profit at 89,000.
- Add a stop-loss at 100,000.
- Timeline: 1-2 days.
Bullish view
- Set a buy-stop at 96,000 and a take-profit at 100,000.
- Add a stop-loss at 90,000.

Bitcoin price remained in a tight range this week, continuing a trend that has been going on in the past two months. The BTC/USD pai traded at 95,000 on Wednesday morning as traders waited for the upcoming US inflation data. It has dropped by over 10% from its highest level this year.
Bitcoin remains under pressure as investors waited for more catalyst for the coin. Tuesday’s Jerome Powell statement did not move the coin. In his statement, he maintained the view that the bank will continue holding interest rates steady since inflation is a big concern.
The Fed prefers annual inflation to be about 2%. Recently, however, inflation has started moving further away from the 2% target, a trend that may continue as sellers adjust their prices because of the recently announced tariffs.
The headline Consumer Price Index has moved from 2.4% a few months ago to 2.9%, while the core CPI has remained above 3%.
Bitcoin will react to the upcoming US consumer inflation data. Economists expect the data to show that inflation remained above the 2.9% in January. A higher inflation figure than that will likely reinforce the Federal Reserve’s hawkish view.
There are signs that Bitcoin demand is waning for now as spot ETFs suffered outflows for two consecutive day. All funds had outflows of over $186 millon, bringing the total assets at $114 billion.
Top Forex Brokers
BTC/USD technical analysis
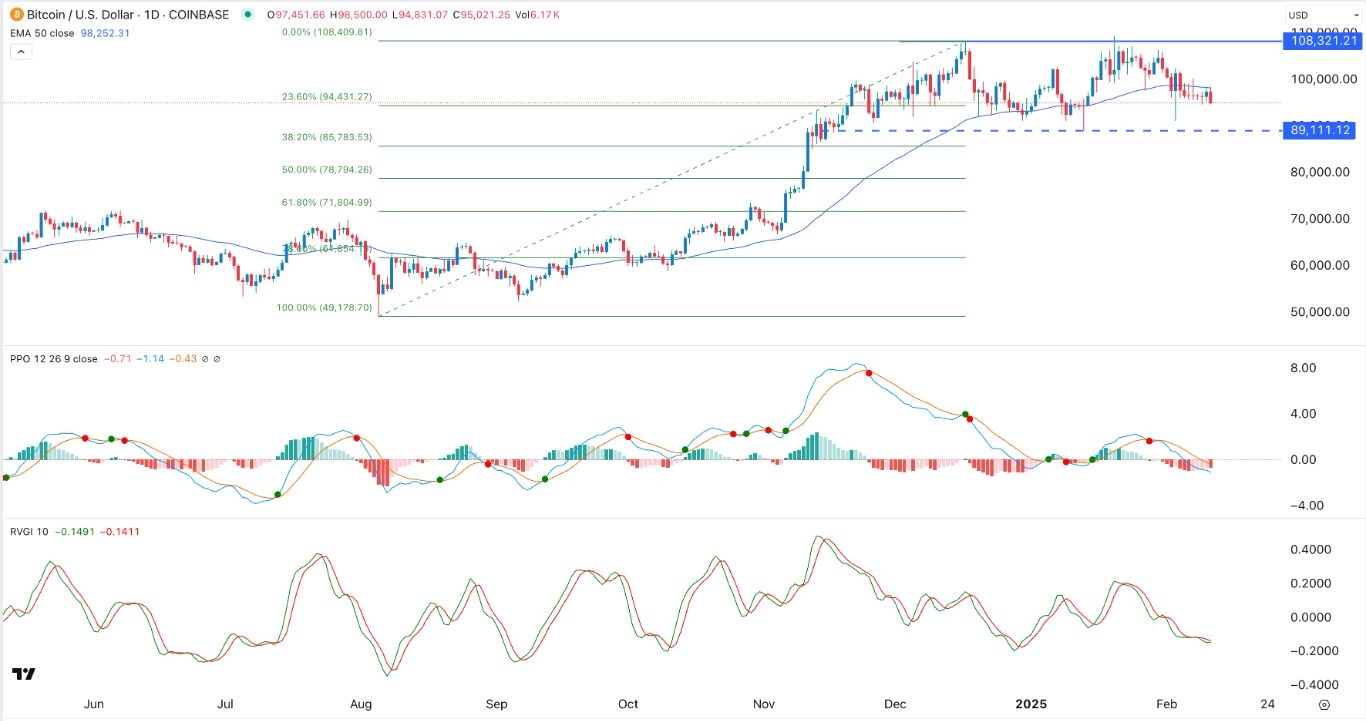
The daily chart shows that the BTC/USD pair topped at 108,320 this year. It has formed a double-top pattern at that level. A double-top pattern is a highly bearish pattern made up of two peaks and a neckline, which, in this case, has moved to $89,111.
The pair has moved below the 50-day Exponential Moving Average (EMA), a sign that bears are gaining momentum. It has also moved to the 23.6% Fibonacci Retracement level. The MACD indicator has dropped below the zero line, while the Relative Vigor Index (RVI) has continued painting downwards.
Therefore, the pair may continue falling with the ext point to watch being at 89,111. A drop below the double-top’s neckline will risk it falling to the 50% retracement level at around 78,000. A move above the resistance level at 108,320 will point to more gains.
Ready to trade our daily Forex signals? Here’s a list of some of the best crypto brokers to check out.
