
Following a month-long decline, AVAX is attempting to consolidate around a key support zone as market sell-off intensifies.
AVAX Struggles Amid Market Sell-off
TradingView data shows that AVAX dipped to an intraday low of $20.34 on February 25, which marked one of its lowest points in months.
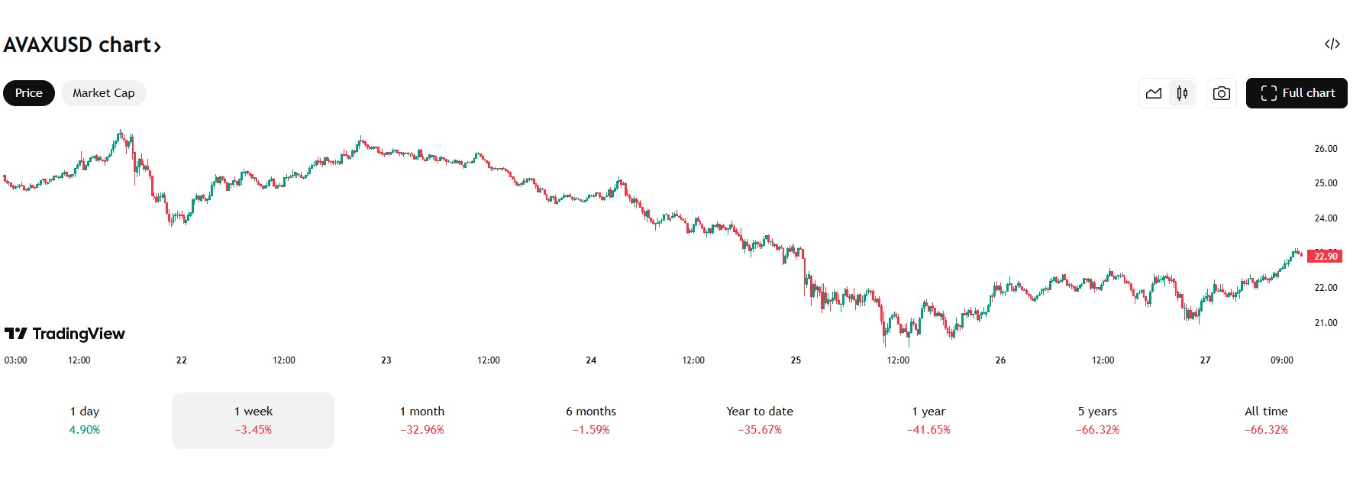
This sharp decline follows an unsuccessful attempt to reclaim the $34.40 resistance earlier this month. Since then, AVAX has dropped over 33% from its February high. This shows a broader market weakness.
On Feb 25, AVAX’s 24-hour volume jumped to about $801 million, roughly double the volume from the day before. This surge coincided with AVAX slicing through the $23 support and tagging the $20 level, which showed a wave of stop-loss triggers and forced liquidation.
The day before, the sell-off had already begun with elevated volume (~$425M), but Feb 25’s volume was especially high, suggesting a possible capitulation point. By Feb 26, volume subsided to around $420 million as the price settled in the $20-$22 range. This implied that the worst of the panic may have passed.
Bulls Attempt to Hold $20 Support
Despite this steep correction, AVAX has found temporary stability near $20, a key psychological support level. Analysts suggest a break below $20 could open the door for further declines toward $17.50-$18, a historically significant support zone.
On the upside, AVAX faces immediate resistance at $22.35, the level where the recent breakdown occurred.
Beyond that, a heavy supply zone exists at $23.60, where on-chain data shows many traders holding breakeven positions. A reclaim of $25-$27 would be needed for AVAX to gain bullish momentum and aim for a $30 recovery.
AVAX Technical Indicators Signal Bearish Pressure
AVAX is currently trading below its 50-day SMA ($32.50) and 200-day SMA ($30.60), which confirms a bearish trend. If the 50-day SMA crosses below the 200-day SMA, it would form a death cross, further reinforcing downside risks.
Meanwhile, the 14-day RSI is at 33, approaching oversold conditions. While this could hint at a potential relief rally, the overall sentiment remains weak.
As for the MACD, it is still in negative territory, though its histogram has recently turned slightly positive. If the MACD line crosses above the signal line, it could indicate waning selling pressure.
Will AVAX Rebound or Decline Further?
With the Crypto Fear & Greed Index for AVAX hovering around 43 (Neutral) after being around 35 (Fear) for the last few days, it shows a more positive outlook.
Even though some traders are looking at the current price levels as an accumulation opportunity, a broader technical outlook suggests that bulls need to reclaim $23.60 and $25 to shift momentum entirely.
Bearish Scenario: AVAX Falls to $17
If AVAX fails to hold $20 support, analysts warn of a potential drop to $17.50-$18, where stronger support lies. A break below this could even push AVAX towards $15, a long-term floor for the asset.
Bullish Scenario: AVAX Reclaims $25-$30
If buyers step in and AVAX moves above $23.60, it could signal a reversal towards $25-$27. A breakout beyond $30 would confirm a trend shift and open the possibility of another attempt at the $34.40 resistance.
At present, AVAX remains at a critical juncture. Traders should watch for confirmation signals, such as RSI moving above 50 or MACD flipping bullish, before making directional bets.
Ready to trade our Avalanche (AVAX) forecast? We’ve shortlisted the best MT4 crypto brokers in the industry for you.