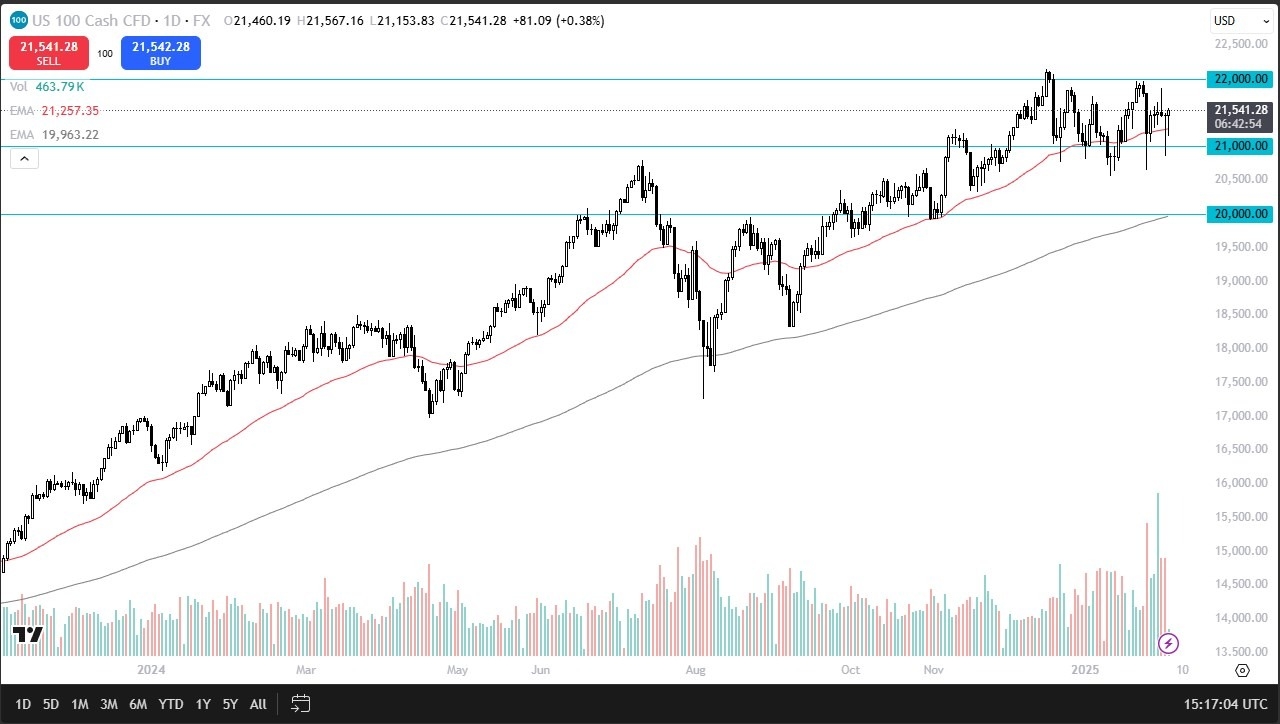
- During the trading session on Tuesday, we saw the NASDAQ 100 dip somewhat significantly during the early hours, but it has found support underneath near the 50 Day EMA.
- Furthermore, we also have the 21,000 level underneath there offering significant support, so I think it all ties together for a market that continues to consolidate.
- I also would point out the fact that the 2 previous candlesticks were a shooting star and a hammer.

In other words, this is an area that seems to be attracting a lot of attention in both directions. Furthermore, you also have to keep in mind that the market is roughly halfway between the 21,000 level and the 22,000 level, both of which have been important support and resistance.
Top Forex Brokers
It’s Still in An Uptrend
The NASDAQ 100 is still in an uptrend, despite the fact that it has been very noisy as of late. Ultimately, this is a market that I believe goes much higher, but we also have to keep in mind that we have had a lot to digest as of late. Because of this, it’s not a huge surprise at all to see that NASDAQ might have to digest the gains for a while and continue to bounce around between the 21,000 level in the 22,000 level. If we can break above the 22,000 level, then it’s likely that this market truly can take off, and perhaps reaching the 23,000 level based upon the “measured move.”
On the other hand, if we were to turn around a breakdown below the 20,600 level, then we might have to retest the 20,000 level as the 200 Day EMA currently sits there, and that of course is something that a lot of people would be paying close attention to. Anything below there would technically have this market in a downtrend, but as things stand right now, I suspect it would take something rather big to make that happen. I believe buying dips continues to be the way forward here.
Ready to trade our stock market forecast and analysis? Here are the best CFD stocks brokers to choose from
